Wednesday, November 30, 2011

Today's Major Market Move: Hungarian Stock Market Up 6.9% in Wednesday's Session. Were the Central Banks bailing out Hungary?

The central planners pulled another card out of their sleeve Tuesday night with 6 central banks (U.S., U.K., Canada, Japan, Eurozone and Switzerland) agreeing to reduce the cost of dollar funding via swap arrangements and China joined in by reducing reserve requirements for Chinese banks. The reaction was strong and immediate in all asset classes and in all regions of the world. The inflation/risk trade was back on in full force.

In the forex markets, the US $ weakened against more than 90% of the world's currencies and the DXY (U.S. $ index) declined 1%.

Click here to go to the live chart.

In the equity markets, more than half of the global equity indexes we tracked had gains of over 3%. The ratio would've been much higher except that the announcement came after many Asian stock markets were already closed. Here's the list of the top performing benchmark equity indexes from Wednesday's session:

Click here to go to the live chart.

In the commodities sector, copper surged over 5%, silver was up almost 3%, gold gained 2% and WTI crude closed over $100/barrel.

Now going back to the title of this post, the Hungarian Traded Index was the best performing benchmark equity index on the planet (taking into consideration that the central bank intervention news hadn't been digested in Asia yet), surging 6.9%. It's also interesting to note that the Hungarian Forint was the 2nd best performing currency, strengthening 2.6% against the U.S. Dollar. Could it be that the central banks' were pushed into action because of an imminent default in either Hungarian sovereign debt or a Hungarian bank? The fact that the intervention occurred just before the open of the European markets would add ammunition to this argument.

The Hungarian economy has been on the ropes. Its sovereign credit rating was recently downgraded to junk by Moody's. The Forint had weakened 30% this year vs. the dollar and its credit default swaps are the 7th highest priced sovereign CDS of the ones we track (look at the 2nd table in this post). With today's global economy teetering on the edge even a country like Hungary, with a mid-sized GDP of $130 billion (according to the IMF), has the potential of setting off a damaging shock wave. When you add in the fact that the banking systems of several Eurozone countries (some like Austria, Italy and Belgium have plenty of their own problems) are dangerously exposed to the Hungarian economy, one can see why the global financial powers would want take aggressive action to avoid a complete Hungarian collapse. The following chart is a little stale (from June 2010) but it sheds some light on foreign banking system exposure to Hungary (source BNP Paribas):


Imagine the following countries as a stack of plates: Greece, Cyprus, Hungary, Italy, Ukraine, Belgium, Ireland, Cyprus, Portugal, Spain and Austria. Then imagine the global financial powers-that-be attempting to juggle them all without letting any one of them slip to the floor. It may very well be that on Wednesday the Hungarian plate slipped through a hand and was caught with a foot.

Tuesday, November 29, 2011

Today's Major Market Move: Ukrainian Equity Market Up 6.8% in November

It's on the fringes of the global economy, in relatively smaller economies like Iceland, Hungary and the Ukraine, where we get a better picture of where things are heading. These fringe countries are the proverbial canaries in the coal mine. In this post we will focus on the Ukrainian economy and stock market, which has been the best performer in November globally, rising 6.8%.

Click here to go to the live table.

Over a longer time frame, the news is less rosy. Year to date in 2011, the Ukrainian Equities Index is down 38%, ninth worst out of all of the global equity indexes we track.

Click here to go to the live table.

We've highlighted the Ukrainian equity market twice before on June 27, 2011 and Oct 22, 2011. We discussed Ukraine's sovereign debt issues and how the country depends on the IMF for financing (IMF's 2nd largest borrower).

It is difficult to pinpoint any major reasons for this monthly rebound and I thought it may have to do with a corresponding uptick in agricultural commodities or steel. However agricultural commodity price gains were a mixed bag in November and steel prices declined (chart courtesy of the LME):

Click here to go to the live chart.

The rebound may not last into December since even though global markets have received a push from recent bailout news, Ukraine just cut their 2012 GDP growth forecast from 5.5% to 4.0%.

Monday, November 28, 2011

Today's Major Market Move: Egyptian Stock Market Up 5% in Tuesday's Session

As a result of the first parliamentary elections since the overthrow of Mubarak (combined with the global euphoria of yet another proposed EU bailout and positive U.S. retail sales data), Egyptian equities climbed over 5% in today's session. Here's the list of the top performing equity indexes:

Click here to go to the live table.

Today's move is a small step towards recouping the losses from 2011. Both main Egyptian equity indexes remain down over 35% for the year.

Click here to go to the live chart.

(The unusual shape of the above chart is due to the fact that Egyptian stock markets were intermittently closed during the initial uprising)

Here's some more color from the AP regarding the headwinds being faced by the Egyptian economy:
The near daily protests have ravaged Egypt's economy, battering the vital tourism sector, driving away foreign investors, put the Egyptian pound under pressure and sharply raised the country's borrowing costs and the costs of insuring its sovereign debt against default.

Late last week, ratings agency Standard & Poor's downgraded Egypt's sovereign rating by one notch, driving it deeper into junk status on the back of the clashes and expectation of continuing political instability.

Sunday, November 27, 2011

Today's Major Market Move: Eastman Kodak (EK) Down 79% for the Year

The worst performing stock in the S&P 500 in 2011 would not be a surprise to most people. Eastman Kodak (ticker: EK) is down almost 80% for the year and is on the verge of becoming a penny stock. Here's a list of the worst performing equities in the S&P 500:

Click here to go to the live table.

I'm not sure what the rules are for removal from the S&P 500 but EK has to be perilously close. Looking at EK's earnings over the past 4 years, we see why the stock price has not performed well. Only 4 out of the past 15 quarters have seen positive earnings and the next 3 quarters are projected to be in the red as well.


Click here to go to the live chart.

At the beginning of the month the company announced they were going to try to generate more cash by taking on more debt and putting more effort into monetizing their patents. This article from the NY Times indicates that many analysts are concerned about their cash position and burn rate.
But investors were most concerned about how quickly Kodak was spending its cash, and on Thursday, the company said it had $862 million left at the end of the third-quarter, 10 percent less than it had at the end of the second quarter.

The company expects to end the year with $1.3 billion to $1.4 billion in cash.

Saturday, November 26, 2011

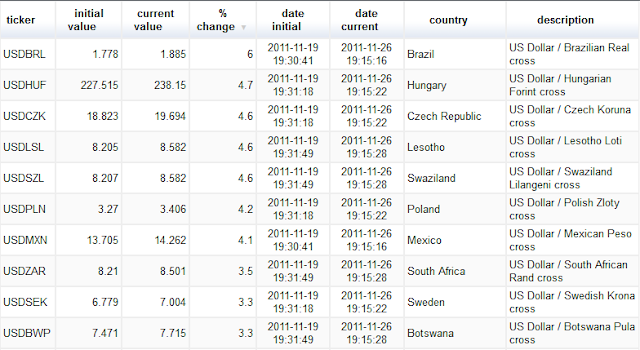
Today's Major Market Move: Czech Koruna Weakens 4.6% vs the USD This Past Week

We talked about the weakening Hungarian Forint on Friday and today we're going to focus on another fringe EU currency, the Czech Koruna. As you could probably guess, the Koruna is in the midst of a weakening trend versus the US Dollar with a decline of 4.6% this past week. It was the third worst performing currency after the Brazilian Real and the Forint.

Click here to go to the live table.

Here's the comparison line chart of the main Czech equity index, the Prague Stock Exch Index, against the USDCZK.

Click here to go to the live chart.

There was a disconnect in the correlation at the beginning of August when Czech equities did a cliff dive. However since then, the correlation has been pretty tight.

I've been wanting to put together a comparison chart of all of the fringe EU currencies since several of them appear to be under pressure. I've left off Belarus since they've already had their hyperinflationary event and the currency has weakened so much that it throws off the chart.

Click here to go to the live chart.

As one can see, the 3 currencies currently under the most pressure are the Zloty, the Forint and the Turkish Lira (we talked about the currency and economic issues of Turkey back in this post).

Friday, November 25, 2011

Today's Major Market Move: Hungarian Equities Decline 4.5% in Today's Session

Hungarian equities have decline 4.5% so far in today's trading session and here's the reason why (other than the general global economic malaise): Moody's downgraded Hungary's credit rating to junk. Some details from Bloomberg:
Prime Minister Viktor Orban, who shunned seeking an IMF loan since coming to power last year until the forint fell to a record against the euro this month, may need to accelerate talks with the Washington-based lender to bolster investor confidence, fund managers at Aegon Fund Management, Aberdeen Asset Management (ADN), and K&H Fund Management said.

“They’ll either have to strike a quick deal with the IMF or the market will force them to,” Viktor Szabo, a London-based portfolio manager at Aberdeen, who helps manage about $7 billion in emerging-market debt, said in a telephone interview. “Hungary may stay one of the worst-performing markets if Europe’s crisis continues.”

We've discussed previously how the optimism from the October European bailout has fizzled out and several equity indexes are now back down to their 2011 lows. Hungary is on the verge of joining that list. Here's a chart of the primary Hungarian equity index, the Hungarian Traded Index:

Click here to go to the live chart.

The Hungarian Forint is also showing renewed signs of stress with the USDHUF breaking out to new highs.

Click here to go to the live chart.


According to tradingeconomics.com, the benchmark 1 year Hungarian interest rate sits at 6%. The central bank is now in a box (which is what eventually happens to all central banks that try to financially engineer prosperity without true fundamental economic progress) where it has to decide if it is going to sacrifice the currency in order to promote growth (or at the very least stabilize the decline).

Thursday, November 24, 2011

Today's Major Market Move: Cocoa Futures Down 29% For the Year

Deflation is currently back in mode. Declining equity markets, defaulting on debts, slowing GDP growth; these are all hallmarks of a deflationary environment. Another obvious sign is declining commodity prices. Soft commodities in particular are down significantly in 2011 with many of them experiencing declines of over 20%: wheat, oats, cotton, sugar, soybeans and the subject of this post, cocoa. Cocoa LI futures have been the second hardest hit after Cotton with prices down 29% on the year.

Click here to go to the live table.
It's hard to find a more specific reason for the decline other than "supply outpacing demand". In this article from Bloomberg Businessweek, an analyst from Macquarie states that they expect prices to increase 13% in the next 2 months as a result of increased demand from Christmas and Easter. I would argue that this is a cyclical demand increase that should already be priced into the market. The custom of buying candy for Christmas and Easter did not just suddenly materialize out of thin air.

Cocoa futures are yet another asset, along with many equity indexes, that are currently at their lows for 2011.

Click here to go to the live chart.

Wednesday, November 23, 2011

Today's Major Market Move: Greek Stock Market Down 20% in November

It hasn't been that long since we last talked about Greece (see this post on Nov 1), but it remains on the leading edge of the European crisis and can't seem to avoid staying out of the news. Greece is quickly running out of cash and is engaged in a game of chicken with the EU. Speeding down the road in car in one direction are the various Greek parties that make up the government which have varying levels of commitment to austerity measures. Careening towards that car is the EU microbus with a compartment full of cash. Will either one of them decide to veer out of the way? We'll soon found out, but in the meantime European equity markets, and in particular Greece, are in the midst of a severe decline. The main Greek equity index (the FTSE/ASE 20 Index) is down 20% for November, second only to mini-Greece (aka Cyprus):

Click here to go to the live table.

It's the same 1-2 configuration when looking at annual performance, with Cyprus in the dubious #1 spot with a 78% decline and Greece following at -64%:

Click here to go to the live table.

While we're talking about Greece, let's check back in with the Greek 1 year bond. Back on Nov 1 we reported that the yield had just crossed the 200% mark. After a big jump on Monday, the yield now sits above the 300% level. I was expecting the yield to stabilize at a level below this because the market is now effectively pricing in a haircut quite a bit larger than the 50% that was agreed to at the end of October. (as this post was being written, the yield just dipped a hair below the 300 level to 297)

Click here to go to the chart on bloomberg.com.

Update: I just stumbled across the reason for the elevated Greek 1 year bond yield; Greece has been directly negotiating with bondholders for larger haircuts.

Tuesday, November 22, 2011

Today's Major Market Move: Austrian Equity Market Declines Over 7% in Past Two Days

The carnage in European debt and equity markets continues. The Austrian stock market has dropped over 7% in the past 2 days and has now joined Greece, Cyprus, Portugal and Belgium in breaking through their previous low of 2011. Here's the worst equity index performers since Sunday:

Click here to go to the live table.

The next tier of Eurozone countries sitting on the precipice of their 2011 lows are France, Italy, Spain, Finland and Luxembourg. Absent a major money printing announcement by the ECB, expect them to join their aforementioned brethren in the not-too-distant future.

Click here to go to the live chart.

The most ominous sign of all regarding the current precarious state of the global economy has to be the fact that since Nov 1, the prices of 5y sovereign CDS have gone up for every major economy in the world. Many have gone up by well over 30%. The CDS market seems to be signaling that the the world now only consists of bailout-ees (recipients); there are no more bailout-ors (donors). Here is the list:

Click here to go to the full table.

Monday, November 21, 2011

Today's Major Market Move: Argentinian CDS Rise 8.3% on Monday

There was a lot of activity in various asset classes all around the world today thanks to the combination of the Super Committee deadlock in the U.S. along with the on going sovereign debt crisis in Europe. One of the larger price moves was actually neither in Europe nor the U.S. but down in South America where Argentinian 5 year CDS gained 8.3%. Here's a list of the biggest price gainers amongst soveriegn CDS on Monday:

Click here to go to the live table.

As you can see Argentina wasn't even the hardest hit; that honor belongs to Russia. We're focusing on Argentina however since Argentina has a much higher default risk in absolute terms. In fact, with today's move, Argentina has passed Portugal and is now only behind Greece in terms of single country sovereign debt default risk. Here's a comparison of performance of the top 5 sovereign credit default swaps (in terms of price) over the last 25 days:

Click here to go to the live chart.

(The Greek line in the above chart is a little out of whack because Greek CDS stopped trading while the dust settled on the recent default on sovereign debt in Greece.)

The only explanation I can come up with for the elevated status of Argentinian CDS is a recent history of debt restructuring. According to the IMF, their debt to GDP is only 49.10% which would make Argentina a paragon of fiscal prudence compared to many other countries (cough, Japan, cough, Italy).

Sunday, November 20, 2011

Today's Major Market Move: Egyptian Equity Market declines 9.6% in November

As the protests in Egypt reenter the "flow" phase, the Egyptian equity market responded by going into an "ebb" phase. People have begun again to set up camp in Tahrir Square to protest the lack of progress begin made towards forming a civilian government. The stock market, which is open on Saturdays, declined 3.4% for the day and is down 9.6% for the month. Here's a list of the worst performing equity indexes for the month of November:

Click here to go to the live table.

The next chart is a measure of the performance of stock market indexes from countries throughout the middle east. We wanted to get an idea of how the equity markets have been affected by the "Arab Spring" uprisings. The effect we're measuring is mostly secondary since of all the countries that have experienced revolutions in 2011 (Egypt, Tunisia, Libya, Syria, Bharain and Yemen), only Eqypt has a stock market index that we are currently tracking. The others either have no stock market of their own or one for which we currently don't have an index to track.

Click here to go to the live chart.

The worst performer from that sample, by far, is Eqypt with a decline of 43%. The next worst performer, Israel, is down less than half of that. Since equity markets around the world are down, on average, in the 10-20% range, it wouldn't be farfetched to state that the spill-over effect of the "Arab Spring" into neighboring economies is negligible.

Saturday, November 19, 2011

Today's Major Market Move: Natural Gas Futures Decline 7.4% for the Week

While WTI Crude Futures have been on a strong run recently (which we last talked about here), Natural Gas Futures on the other hand have been plumbing the lows of 2011. Front month contracts declined 7.4% last week, making it the worst performing commodity of the ones we track.

Click here to go to the live table.

The reason for the most recent decline was the release of data indicating that U.S. natural gas storage is at record levels. Some more commentary from the Calgary Herald:
Storage is near capacity on both sides of the border, with Canadian inventories 96 per cent full, boding well for consumers but not for producers, say analysts.

"The outlook for natural gas is not getting any rosier," said Chad Friess, analyst with UBS Securities. "It may stay depressed over the mid-term until it can get more outlets for supply."
Here's the current line chart for 2011. Prices just broke through the 2011 lows and are on their way to approaching sub 3.00 levels.

Click here to go to the live chart.

Friday, November 18, 2011

Today's Major Market Move: Lithuanian Stock Market Declines 8.2% for the Day

8% single day declines in equity markets are pretty rare but unfortunately for Lithuania, they experienced one on Thursday. As a point of reference, the maximum decline of the Dow on the day of the 'Flash Crash' was 9% and the market ended up closing the day down 'only' 5%. The Lithuanian stock market was by far the biggest decliner of the day:

Click here to go to the live table.

This appears to be the reason for the sell-off (from reuters):
Lithuania unexpectedly took control of Snoras -- the country's fifth largest bank by assets and the third by deposits -- at the request of the central bank, which said it found a 1 billion litas ($391.7 million) hole in the bank's assets, and prosecutors said they opened a probe.
As to be expected, Lithuanian authorities are playing down this event, attempting to calm the markets with statements like:
  • "Lithuania probably won't need to inject public money"
  • "There is absolutely no panic"
  • "Only 2 percent of deposits were withdrawn on Thursday."
  • "Snoras takeover was no threat to the banking system because its total exposure to interbank lending was less than 23 million euros."
All of those statements are essentially variations of "this is contained" but as we've seen time and time again, there is rarely one cockroach. The stock market is approaching this event with a "sell first ask questions later" mind set. I doubt this will have significant reverberations out side of the Baltics, but I wouldn't surprised to see after shocks within Lithuania itself as well as in Estonia and Latvia. 

I was just about to write about how the response in the currency markets was much more muted and that the Lithuanian Litas barely moved on Thursday. Then I thought to myself "hmmm, I wonder if there's a peg?" Sure enough, the Litas is pegged to the Euro. I wonder how much central bank firepower it took on Thursday to maintain it. 

The other Baltic equity markets had very little reaction on Thursday. For the year, Latvia has held up very well, down only 3.8%. Estonia has had more of a struggle with its stock market down over 25%.
Here's the chart of the 3 equity markets in terms of % change:

Click here to go to the live chart.

Thursday, November 17, 2011

Today's Major Market Move: Argentina Equities Down 16% This Month

We're a little over halfway through November and many equity markets don't have much to be thankful for. Out of all the global equity indexes we track, 90% of them are in the red this month. The worst performer is one of the usual suspects, Cyprus, which is down another 29% for November and 75% for the year. The next worst performer, Argentina (down 16%), is in a region that has for the most part avoided collateral damage from the crisis in Europe. In fact Venezuela, thanks to the "Oncological Boom", is up an astounding 74% in 2011 (we last discussed Venezuela here). Here's a list of the worst performing global equity indexes for the month of November:

Click here to go to the live table.

Here's the line chart of the equity indexes of the major South American economies for 2011 (in % terms):

Click here to go to the live chart.

From an equity perspective (and one could argue political as well), Venezuela is on another planet. Peru and Chile are holding their own whereas Argentina and Brazil are showing more weakness. Argentina is quickly approaching the lows of 2011. Peru and Chile both have large mining industries and the relative strength of metals has buoyed their economies. Here's a chart of copper, gold and silver prices for 2011:

Click here to go to the live chart.

Wednesday, November 16, 2011

Today's Major Market Move: WTI Crude breaks $100/barrel

Back on Oct 26th after crude had climbed 14% for the month, we stated the following in our blog: "If equities continue their strong run and the perception remains that the European problems have been fixed or at least alleviated, don't be surprised to see $100 or higher WTI crude prices in the near future." It's now exactly three weeks later and the second half of that statement has come to pass. At the time of this post, WTI Crude futures are up 2.6% for the day and last traded at $101.89.

Click here to go to the live chart.

What's truly ominous is that the preconditions of my Oct 26th statement ("equities continue their strong run" and "perception remains that the European problems have been fixed or at least alleviated") turned out to unnecessary for oil to continue its run higher.
Here's how some global equity indexes have performed since Oct 26:

Click here to go to the live chart.

As you can see, the stock markets in major economies are flat to down. How about the progress on fixing the European debt crisis? Let's take a look at credit default swaps:

Click here to go to the live chart.

Bear in mind that increasing credit default swap prices means a higher default risk on the bonds (i.e. it's bad).

Besides currency devaluation and inflation fears, here are some other items that are potentially impacting oil prices:

-Potential Israeli strike on Iran
-Instability in Iraq due to U.S. pullout.
-legal battle surrounding the TransCanada Keystone XL pipeline
-the ongoing uprisings in the Middle East
-decrease in U.S. crude oil stocks

We now have some people calling for $200 oil in the not-too-distant future. I don't think we get there in the next 2-3 years. Anywhere above $150 puts a huge dampener on economic activity and also saps the political will for central banks to increase liquidity. I believe we would see the S&P 500 hit new post-crisis lows (sub 666) before we would see WTI above $150.

Tuesday, November 15, 2011

Today's Major Market Move: Spanish CDS Rise 35% Since Nov 1

As European CDS continue to rise higher, two of the worst performers (higher price = increased default risk) have been Austrian (which we discussed here) and Spanish swaps.

Click here to go to the live table.

Despite apparent 'progress' in dealing with the European economic crisis (G-Pap and Silivo stepping down, reaffirmation of commitment to austerity measures, EFSF expanision, continued ECB bond buying) many European CDS prices have climbed higher.

Click here to go to the live chart.
The most ominous line in that chart is red (France). The market is slowly coming to the realization that between the bailout-ors and the bailout-ees, the only valid member of the bailout-or group is Germany. Furthermore, Germany is mathematically incapable of backstopping the entirety of the rest of the Eurozone. As a result of this realization, we have companies like Deutsche Bank pleading with the ECB to go all-in on money printing. Zerohedge obtained a copy of a recent presentation made by DB analysts in which it was stated:

And here is what DB thinks has to be done right now.
  • More progress on credible fiscal austerity (especially Italy)
  • Rapid resolution of the EMU's original sin - lack of fiscal integration (Dec 9 EU Summit meeting)
  • Restore confidence to re-open bank funding markets
  • Time to expedite the "Grand Plan"
    • Larger Greece debt restructuring
    • Bank capital raises and debt guarantees
    • Additional bail-out funds for Greece
  • Time to call the ECB
    • Investor reluctance on EFSF € 1 trillion leverage plan
    • Ineffectiveness of ECB monetary policy transmission mechanism to keep bond yields low
    • Adjustment away from current bond purchase program needed (away from temporary, limited and sterilized)
    • ECB should announce large, targeted buying plan (i.e. € 200 bn over 12 months)

The 2 key items are in bold. This is just another example of attempting to avoid near term pain for what in all probability will end up being a larger crisis down the road. Does this fundamentally alter what is the equivalent value in oil of a lifetime salary, including pension, of a Greek hairdresser? Can the European technocrats engineer a solution where the annual labor of all the Italian bureaucrats when valued in gold, is sustained? I believe there are primal, fundamental economic forces currently at work that no amount of central bank asset purchases or interest rate massaging will be able to bring to a halt.

Monday, November 14, 2011

Today's Major Market Move: Mastercard (MA) is Up 57% for the Year

One of the top performing equities this year has been Mastercard (ticker: MA) which has gained 55% so far in 2011. Here are the top 10 performing stocks in the S&P 500 since January:

Click here to go to the live table.
Since its IPO in 2006, MA is up a remarkable 765%. The company has rebounded strongly from the depths of the 2008 crisis, growing earnings steadily since then. Below are EPS charts for MA in 1) absolute terms and 2) in % terms alongside stock price.


Click here to go to the live charts.

A cap on debit card processing fees went into effect on Oct 1 as part of the Dodd-Frank financial reform bill and initially there was some concern that this regulatory change might diminish the willingness of banks to issue debit cards. More recently, representatives from Mastercard and Visa have stated that they don't expect the new regulatory landscape to have an effect on the trend of increasing debit card usage.
From reuters:
Debit and ATM executives for MasterCard Inc and Visa Inc said on Wednesday they expect debit card use to grow, despite new U.S. government rules that cap fees banks can charge merchants.

Executives for the world's two largest payment processors said at an industry conference on Wednesday that consumers will increasingly use debit cards for everyday purchases, despite fears their use could be curbed due to price caps introduced by the Dodd-Frank financial reform law's Durbin amendment.

"Consumers are flocking to debit cards because they are intrinsically superior to checks," said Leland Englebardt, Mastercard's group head for global network products, overseeing the company's ATM business.

Sunday, November 13, 2011

Today's Major Market Move: Austrian CDS Rise 32% in November

The worst performing of individual sovereign CDS for the month of November has been Austria (by worse we mean increasing default risk). Its 5 year CDS have gained 32% since Nov 1. In absolute price terms Austrian debt is still considered relatively safe but Austrian banks have above average exposure to Eastern Europe which has been having issues lately (see our recent post on Hungary). Here's the list of the top CDS price gainers in the current month:

Click here to go to the live table.

Austrian equities on the other hand have been relatively flat lately. The Austrian ATX Prime Index has been sitting near the 2011 lows for the last month and a half:

Click here to go to the live chart.

Austria is one of the few countries in the Eurozone (along with France and Germany) to still be rated AAA however some internal folks have recently expressed some concern about maintaining that rating. From reuters:
Austria has to tighten its belt to preserve its AAA sovereign debt rating and could reduce its stakes in some big companies to cut debt, Foreign Minister Michael Spindelegger said.

"We are heading towards a debt spiral from new and old debt. We absolutely have to avoid getting drawn into this vortex," he told the Kurier newspaper in an interview published on Saturday.

He noted than even a one-notch downgrade would boost annual debt service costs by 3 billion euros ($4.1 billion).

Saturday, November 12, 2011

Today's Major Market Move: Hungarian Forint Weakens 5.5% vs the USD in Past Two Weeks

As Europe continues to struggle through the current crisis, the countries on the fringe of the Eurozone are feeling the reverberations. Both the Hungarian Forint and the Czech Koruna have weakened noticeably over the past two weeks, with the USDHUF climbing 5.5% and the USDCZK up 6.6%. Here's the list of the worst performing currencies since 10/29:

Click here to go to the live table.

The Forint has now broken out to a new 2011 high (although it did retrace some on Thursday and Friday):

Click here to go to the live chart.

Things aren't going to get any easier for Hungary this coming week. Over the weekend Fitch cut the ratings on some Hungarian sovereign debt and S&P placed the country on credit watch negative. Businessweek has some commentary from S&P:

Hungary’s “unpredictable” policies, including the dismantling of checks on policies, levying of extraordinary industry taxes and forcing lenders to swallow exchange-rate losses on loans, are harming investment and growth at a time when the economic environment is deteriorating, S&P said.

“A more unpredictable policy environment, stemming from a weakening of oversight institutions and some budgetary revenue decisions, will have a negative effect on economic growth and government finances,” S&P said. “Downside risks to Hungary’s creditworthiness are increasing as the external financial and economic environment is weakening.”

I would also expect to see a sizable move in Hungarian CDS in the next few days, although so far this month the CDS have remained relatively unscathed. Here's the top price gainers in government CDS since Nov 1:

Click here to go to the live table.

Friday, November 11, 2011

Today's Major Market Move: CSC (Computer Sciences Corporation) Drops 18% in the Past Week

While overall the U.S. equity markets were mostly flat last week (the S&P 500 was up .8%, the DJIA up 1.3%), one stock that had a rough time was Computer Sciences Corporation (ticker: CSC), which declined 18%. Here's the list of last week's worst performing stocks in the S&P 500:

Click here to go to the live table.

CSC announced its fiscal 2nd quarter results this past Thursday and as you could probably guess from the stock performance, the results were a disaster. Pro forma earnings actually came in well ahead of expectations: $.94/share vs $.68/share estimate. However on the negative side they had 2 one time charges (one was a huge goodwill impairment charge for $2.69 billion) and they guided future yearly earnings lower from $4.80-4.70 to $4.10-4.05.

Here's a chart of the % change of earnings estimates, earnings actuals (pro forma) and stock price:

Click here to go to the live chart.

Hopefully this latest goodwill impairment was a "kitchen-sink" type charge off, giving the company some breathing room to avoid future one-time charges in the next few quarters. Goodwill impairments tend to be rather fuzzy and give a company the opportunity to "massage" their balance sheet.

Thursday, November 10, 2011

Today's Major Market Move: WTI Crude Futures Up 4.9% for the Week

The last time we discussed WTI Crude futures was back on Oct 26 after they had a nice 14% run up. In that post we cautioned "don't be surprised to see $100 or higher WTI crude prices in the near future". It's now a little over two weeks later and WTI is sitting on the threshold of triple digits at $99. Here's the top commodities gainers for the past week (with energy and PMs filling in the top 7 spots):

Click here to go to the live table.


Part of the reason for the run up has to do with the activity in Europe and the stimulative measures (ESFS exapansion, ECB bond purchases) being taken to deal with the sovereign debt crisis. There's also been a lot of chatter lately about Israel preparing for a strike on Iran. Both WTI and Brent have had nice recent gains but its interesting to see that the spread between the two has narrowed considerably.

Click here to go to the live chart.


Because the most recent crisis is centered in Europe, the expected slow down in economic activity and energy usage in that region could be tempering the move in Brent (Brent crude originates in Europe).

Going forward I expect to hear conflicting messages coming out of the ECB as they attempt to keep a lid on Italian bond yields while at the same time try to avoid a run up in oil prices.