Saturday, December 31, 2011

Today's Major Market Move: Cotton Futures Decline 40% in 2011

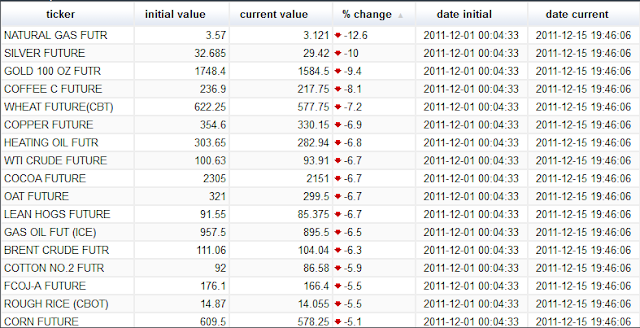
On balance, the commodity complex signaled deflation in 2011 with price declines occurring in 18 out of the 27 commodity futures that we track. The largest decline was in cotton futures, which dropped 40% from the end of January and are off 58% from their 2011 highs. Here's the list of the top ten decliners:

Click here to go to the live table.
We focused on cotton back on November 3rd and at that time prices were down 35% for the year. We referenced the International Cotton Advisory Board which had projected that as a result of an increasing surplus, cotton prices would remain soft going into 2012. Score one for the ICAB.

Here's the line chart for cotton going back to January 2011:

Click here to go to the live chart.

Friday, December 30, 2011

Today's Major Market Move: Hungarian Stock Market Declines 2.3% in Friday's Session

Hungary has popped up as the topic of our Major Market Move post three times over the past 2 months (for the Forint see December 22 and November 12, for the Hungarian equity market see November 30) and today it has managed to accomplish the feat again. On a day when only 25% (80 out of 320) of the equity indexes we track finished in the red and most of Europe was in the black, the benchmark Hungarian Traded Index was the worst performer, falling 2.3%.

Click here to go to the live table.
In the December 22 post we discussed how Hungary was playing hard to get with the IMF and EU by not acquiescing to all of their demands. By being obstinate, Hungary is risking further outside financial assistance which by most accounts the government desperately needs in order to meet its financial obligations. One of the points of contention was a Hungarian law that was approaching passage that would limit the central bank's independence. Today we got this news (from The Gulf Daily News):

BUDAPEST: Hungary's parliament defied international concern and yesterday adopted a reform of the central bank that critics say increases the government's influence over monetary policy.

Legislators approved by a vote of 293-4 the law which led the European Union and International Monetary Fund (IMF) to walk out of talks earlier this month on a possible bailout for Hungary worth 15-20 billion euros ($20-25bn).

Prime Minister Viktor Orban, however, rejected a call by the head of the EU executive, Jose Manuel Barroso, to withhold adopting the legislation until it is brought into line with EU law, and the parliament went ahead and passed the bill into law.

The act expands the central bank's rate-setting monetary council to nine people from seven, with the two additional nominees to be appointed by the parliament which is dominated by Orban's centre-right Fidesz party.
Not just Hungary's equity market was punished by this event, but also the Forint, where the USDHUF is trading at the 2011 highs. Here's the annual chart of the Hungarian Traded Index against the USDHUF:

Click here to go to the live chart.
As we've mentioned before, we anticipate that the potential spark for a next down leg in Europe would not come from a country within the Eurozone or even the EU, but from one of the countries lying on the fringes such as Hungary, Poland, Turkey, Serbia, etc.

Thursday, December 29, 2011

Today's Major Market Move: Turkish Lira Weakens 4.6% in December

Back on August 3rd we discussed how the managers of Turkey's economy found themselves in a conundrum. Here's an excerpt:
That chart has to represent a central banker's worst nightmare: a currency that is weakening at the same time that equity markets are declining. It's a financial Sophie's Choice; protect the currency at the risk of crashing the stock market or allow the currency to continue to weaken in an attempt to provide support to equity investors? This one's going to be interesting to watch.
It's time for a little update. Since the beginning of August the Lira has weakened another 13% against the US Dollar and the benchmark while the benchmark Turkish equity index (the ISE National 100 Index) has gained 1.9%. Here's an update of the chart where we compare the two:

Click here to go to the live chart.
This is not what a central bank wants or expects to happen when they devalue their currency; they're hoping for at least some inflation to carry over into equities. Furthermore, imagine what has happened to the price of oil and other commodities in Turkey. A barrel of oil (WTI Crude) priced in US dollars has gone up 12% in 2011. When priced in Turkish Lira, that same barrel of oil has gone up 40% (1.12 * 1.25).

It seems that the Turkish Central bank is shooting in the dark looking for something to reverse the trends and it is creating confusion in the market. They recently announced that they will go from having loan auctions on every day to only staging the auctions on certain days, without much advanced notice.  Here are some comments from traders and market analysts regarding the central bank's actions (from Bloomberg):
-Turkish central bank policy “has spurred confusion and fear,” said Baris Karaayvaz, a trader at Turkiye Garanti Bankasi AS. “We again fail to understand the governor’s comments. The bank says, leave it to me to decide what is an exceptional day. It says, if I do something extraordinary, than it is an exceptional day.”

-“Whenever Basci speaks, he disrupts the market ,” Burak Demircioglu, a trader at EFG Istanbul Securities said in e- mailed comments. “Nothing is clear and this is disturbing the markets. The bank is using tools inconsistent with its statements and this is confusing people.”

-“The central bank taking on such an active role is counterproductive,” Ozhan Antero Atilla, emerging-market analyst at Danske Bank A/S, said in e-mailed comments. “We will come to a stage where foreign markets will not heed Basci’s comments. The bank acts as if it has to do something whenever the lira moves past 1.90.”

Wednesday, December 28, 2011

Today's Major Market Move: Russian Stock Market Declines 8.5% in December

It's been a rough month for the BRIC equity markets; all four were in the red and two of them were in the bottom 3. Here's the list of the worst performing benchmark equity indexes for the month of December:

Click here to go to the live chart.

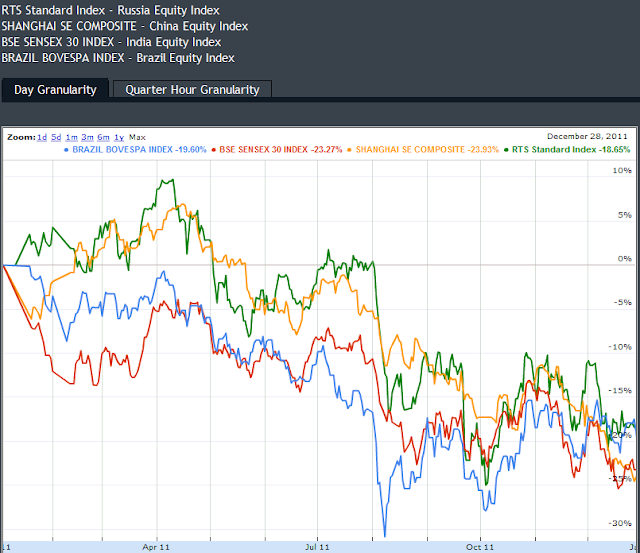
We talked about China's stock market on Dec 13th when it fell to new 2011 lows, so in this post we're going to focus on Russia. The benchmark RTS Standard Index fell 8.5% for the month, but it is still sitting above the 2011 lows. Here's a comparison of all four benchmark BRIC equity indexes for the past year.

Click here to go to the live chart.

All four indexes have tracked each other fairly closely in 2011 are all down around 20% for the year.

Another point of potential concern for Russia is the Ruble which has been showing some weakness lately. The USDRUB cross is getting very close to its 2011 highs.

Click here to go to the live chart.

Tuesday, December 27, 2011

Today's Major Market Move: Sears Holding (SHLD) Down Over 10% in Tuesday's Session

Despite Jim Cramer's  exaltations, Eddie Lampert is still struggling with turning around retailer Sears (ticker: SHLD) and its acquired vanishing twin, Kmart. Today the company announced that they were closing at least 120 full-line stores and same store sales were down 5.2% YOY for the 8 weeks that ended Christmas day. The impact to the stock price was a 10.2% decline for the day, making it the worst performer in the S&P 500.

Click here to go to the live table.

Longer term the story isn't any better with the stock down 55% for the year.

Click here to go to the live chart.
From an earnings estimates perspective, the company just had its worst quarter since at least the 1st calendar quarter of 2008, and only 2 out of the upcoming 8 quarters are expected to be in the black.

Click here to go to the live chart.
If only it were feasible for Sears to shut down the company from January to September and then open up for just the Christmas season.

Monday, December 26, 2011

Today's Major Market Move: Chinese Yuan Strengthens 4.2% Against the US Dollar in 2011

It may not sound like much, but the 4.2% that the Yuan has strengthened against the US Dollar this year makes it the 3rd best performing currency. Here's the top ten:

Click here to go to the live table.
Here's the 2011 line chart of the USDCNY cross and one can see that the trend has been fairly steady.

Click here to go to the live chart.

One has to wonder how much the improvement in the Yuan has to do with the fact that the U.S. is approaching an election year and all of the associated rhetoric that it brings. It must concern China that Romney, who typically polls in the top 2 or 3, has been the most vocal on Chinese currency manipulation and trade policies.
“I'm afraid that people who've looked at this in the past have been played like a fiddle by the Chinese,” Romney said. “And the Chinese are smiling all the way to the bank, taking our currency and taking our jobs and taking a lot of our future. And I'm not willing to let that happen.” Romney went on to reiterate that he would sign an executive order on his first day in office “identifying China as a currency manipulator” and that he would take that case to the World Trade Organization.

Sunday, December 25, 2011

Today's Major Market Move: Brazil Electric.Energy IX Index Rises 9.5% in December

If you combine globally rising energy/commodity prices with a generally well performing equity market in Brazil, you get the best performing equity index for the month of December. The 'Brazil Electric.Energy IX Index' rose 9.5% this month to lead all of the equity indexes that we track.

Click here to go to the live table.

Another interesting aspect to this particular equity index is that it tracks Brazilian GDP growth quite closely. Here's a chart of % growth of 5 Brazilian equity indexes and gdp (actual and estimated).

Click here to go to the live chart.

The Brazil Electric.Energy IX Index is also performing very well for all of 2011 where it is up 27% and sitting right at the highs:

Click here to go to the live chart.

Saturday, December 24, 2011

Today's Major Market Move: Gasoline Futures Gain 8% for the Week

It was a strong week for commodities in general with 27 out of 29 commodity futures in the black. The best performer was Gasoline futures with a gain of 8% followed by WTI Crude futures which rose 6.6%. Here's the top performers of the commodity futures we track:

Click here to go to the live table.

The typical seasonal pattern of gasoline prices held true for 2011 with prices peaking in May and bottoming in December. This does not bode well for consumers going forward as the expectation is for prices to rise over the next few months.

Click here to go to the live chart.
We put together a combined chart of Gasoline and WTI Crude futures along with the S&P 500 to see if there were any apparent correlations. There are some shorter duration correlations, such as between WTI and the S&P from August through October, but nothing that lasts the entirety of the year.

Click here to go to the live chart.

Friday, December 23, 2011

Today's Major Market Move: Montenegrin Stock Market Rises 8% in Past Week

Santa Claus was pretty good to global equity markets for Christmas, with 70% of benchmark global equity indexes in positive territory for the week prior. The 2nd best performer was the Montenegrin Stock Market which posted an 8% gain

Click here to go to the live table.

If we expand our view back further, the picture is not quite so rosy. Their stock market is down over 30% since March:

Click here to go to the live chat.

and it has a lot of ground to make up if it wants to show any kind of correlation with expected gdp growth:

Click here to go to the live chart.

Thursday, December 22, 2011

Today's Major Market Move: Hungarian Forint Weakens 4.6% Versus the US Dollar This Month

Back on November 30th when there was a coordinated central bank action to reduce the cost of dollar funding, we speculated that the struggling Hungarian economy might have been the main impetus for the timing of that event. An excerpt from that post:
Its sovereign credit rating was recently downgraded to junk by Moody's. The Forint had weakened 30% this year vs. the dollar and its credit default swaps are the 7th highest priced sovereign CDS of the ones we track (look at the 2nd table in this post). With today's global economy teetering on the edge even a country like Hungary, with a mid-sized GDP of $130 billion (according to the IMF), has the potential of setting off a damaging shock wave. When you add in the fact that the banking systems of several Eurozone countries (some like Austria, Italy and Belgium have plenty of their own problems) are dangerously exposed to the Hungarian economy, one can see why the global financial powers would want take aggressive action to avoid a complete Hungarian collapse.
The Hungarian economic metrics are at or approaching those pre-November 30 levels. The Forint has weakened 4.6% against the Dollar this month and the USDHUF is on the verge of a new 2011 high:

Click here to go to the live chart.

The benchmark Hungarian equity index, the Hungarian Traded Index, is close to the 2011 lows  (8% away):

Click here to go to the live chart.

And the Hungarian 5 Year CDS is trending towards the 2011 highs:

Click here to go to the live chart.
S&P followed in Moody's footsteps and downgraded Hungary's debt to junk on Wednesday. Hungary's president has been in talks with the EU and IMF regarding additional financing but they've yet to reach an agreement. The EU and IMF want Hungary to rescind a couple of laws, one regarding central bank independence and the other that put into place a flat tax. There's a pretty good game of chicken going on. Some more color from Reuters:
"But there is also a risk that Hungary's government will try to soldier on without outside financial support, instead turning to more unorthodox policy measures," it said.

The opposition Socialists have called on Fidesz to replace [Hungary's president] Orban, but political analyst Zoltan Kiszelly said Orban's big majority in parliament cemented his position.

He said Orban was unlikely to change course at this stage as he needed a good political exit strategy to be able to make such a marked shift in economic policy.

"He is hoping that the other side (the EU) would swerve first," he said.

Wednesday, December 21, 2011

Today's Major Market Move: Cypriot Stock Market Rises 4% in Wednesday's Session

Back on Thursday of last week, after WTI Crude had dropped down to 93.91, we made the following comment:
The most important take away from all of this is the fact that both WTI and Brent Crude were down over 6%. This means there's more room for the Central Banks to provide liquidity. Be prepared for more action (or at the very least, proposed action) by the CBs over the coming days and weeks.
So earlier today we got the following news (source WSJ):
The European Central Bank received orders for €489.19 billion ($639.96 billion) of three-year loans for banks under its latest long-term refinancing operation, far ahead of expectations and a record for any ECB facility. That should ensure the financial season of peace and goodwill extends well into the New Year, although whether it provides any longer-term solution is less clear.
The reaction in European equity markets wasn't quite as strong as one would've expected, with only one Eurozone equity market, Cyprus, among the top 10 performing benchmark equity indexes on Wednesday.

Click here to go to the live table.

WTI Crude front month future contracts are back up to 98.90, so I'd be surprised to hear any other announcements of major CB interventions at these levels. Here's the WTI line chart:

Click here to go to the live chart.

Tuesday, December 20, 2011

Today's Major Market Move: Cocoa Futures Advance 5.6% in Tuesday's Session

After declining in the previous four trading sessions, Cocoa futures bounced back today to lead commodities (of the ones we track) with a 5.6% gain. Here's the list of today's top performers:

Click here to go to the live table.

There doesn't appear to be any cocoa specific news related to the rebound, it just seems to be a combination of a relief rally in cocoa along with an overall "risk-on" sentiment across all markets. For the year, Cocoa futures are struggling along with the rest of soft commodities and prices have declined 31% since January.

Click here to go to the live chart.

We last discussed cocoa futures on Nov 24th which at that time were down 29% for the year (we talked about cocoa futures li which are essentially cocoa futures priced in GBP). We mentioned how a Macquarie analyst was expecting cocoa prices to rise 13% in the following 2 months. They're running out of time...

Monday, December 19, 2011

Today's Major Market Move: Bermuda Stock Exchange Declines 10% in 2011

On a relative basis, a decline of 10.3% from the beginning of 2011 and a decline of 19% from the highs of 2011 are not particularly bad. Consider that the two worst performing equity markets, in Greece and Cyprus, have seen declines of 62% and 77% from the beginning of 2011, and declines of 69% and 81% from the highs of 2011. However what makes the situation precarious for Bermuda is the fact that the 19% decline from the highs occurred in steady drop in only 4 months. Furthermore, the most recent news is not encouraging as the stock market declined 5% today to bring it to new lows.

Click here to go to the live chart.

As a political entity, Bermuda is a British overseas territory with quasi independence. The IMF doesn't maintain separate GDP data for Bermuda so unfortunately we're unable to make a comparison between stock market performance and gdp growth. Their currency (Bermudian Dollar) is pegged to the US Dollar and the US also happens to be by far their largest trading partner so they would have to break the peg if they wanted to join in on the global "lets-devalue-our-currency-to-increase-exports" fun and games.

Sunday, December 18, 2011

Today's Major Market Move: Kenyan Shilling Strengthens 6.7% Against the US Dollar in December

After weakening as much as 32%, the Kenyan Shilling is almost back to even for the year. It's had a particularly strong December so far as it has been the best performing currency versus the US Dollar, strengthening 6.7%. Here are the top performers:

Click here to go to the live table.

The last time we mentioned the Kenyan economy was in a post on the Burundian Franc on Dec 7. We mentioned an article in AllAfrica.com that claimed that the inflation rate in Kenya as of October was 18.9%. We haven't been able to find updated data but we would expect that inflation must have improved significantly in order for the currency to have strengthened as much as it has. Here's the full year line chart for the USDKES cross:

Click here to go to the live chart.

From an equities perspective, the Kenyan stock market is still struggling for the year, down 31%. The benchmark Nairobi All Share is the 11th worst performing benchmark equity index in 2011:

Click here to go to the live table.

Saturday, December 17, 2011

Today's Major Market Move: Cypriot Stock Market Declines Over 10% in Past Week

It's been a little while since we've featured Cyprus as the subject of our 'Major Market Move' post as the equity market there appeared to have stabilized itself over the past couple of weeks. The last time we discussed the Cypriot Stock Market was on Nov 5 after a staggering 20% weekly drop, which brought the annual decline to -71%.  The current news is unfortunately again negative with the market having just experienced a 10% weekly drop and the annual decline now sits at -78%. Here's the line chart for the main Cypriot equity index for 2011:

Click here to go to the live chart.

Here's the worst performing benchmark equity indexes for all of 2011:

Click here to go to the live table.
Granted with a GDP of a little over 23 billion, the Cypriot economy doesn't exactly dominate the Eurozone landscape. However we consider these smaller sized economies, such as Iceland, Belarus and Burundi potential canaries in the coal mine. The canary metaphor might not even be the best fit; maybe we should be calling them hummingbirds.

Friday, December 16, 2011

Today's Major Market Move: PIIGS Credit Default Swap Jumps 50% in One Day

There's been some very odd behavior in Eurozone credit default swaps lately. Bloomberg provides quotes for a combined PIIGS CDS which I can only assume, since I haven't been able to find more detail anywhere, is a swap that pays off if any one of the 5 PIIGS countries (Portugal, Ireland, Italy, Greece, Spain) defaults on their bonds. This CDS jumped in price by 50% in today's trading session, a massive move.

Click here to go to the live chart.

Now one would logically expect that there would be a proportional move in one or all of the individual countries' CDS. Here's a chart of the 5 Year CDS for Portugal, Ireland, Italy and Spain (we'll get to Greece in a second).

Click here to go to the live chart.
All four of them declined in price today so assuming that all of these quotes are accurate (it's very possible we're dealing with a bad print here), that would mean that there was a ridiculously large jump in the Greek 5 Year CDS. Unfortunately the last time we were able to get anything resembling an accurate quote on the Greek 5 Year was back on Dec12th. Bloomberg has been showing a price of zero for the last few days. But let's go ahead and take a look at the Greek CDS up until the 12th:

Click here to go to the live chart.

If accurate, that chart shows a 100% jump in the Greek 5 Year since the middle of November. This is surprising considering that Greek bondholders and Greece agreed to a 50% write down in October and furthermore, the ISDA ruled that since the agreement was 'voluntary', CDS payouts would not be triggered. So based off of this information, one would expect Greek CDS to be relatively stable. But hold on a second, it turns out that since October, Greece has been negotiating for an even larger write down. From Reuters on Nov 26:
The Greeks are demanding that the new bonds' Net Present Value, -- a measure of the current worth of their future cash flows -- be cut to 25 percent, a second person said, a far harsher measure than a number in the high 40s the banks have in mind.

Banks represented by the IIF agreed to write off the notional value of their Greek bondholdings by 50 percent last month, in a deal to reduce Greece's debt ratio to 120 percent of its Gross Domestic Product by 2020.

I would imagine that this development must be generating significant uncertainty in the markets about the sustainability of the original agreement. As a further complication, it was reported on Wednesday by the Irish Times that the EU and the IMF might withhold the €130 billion rescue package.
Details of a deal agreed in October, in which bondholders accepted to a 50 per cent haircut on the face value of their bonds, have to be wrapped up before the €80 billion first tranche of new funding can be disbursed, a Greek official said. “We expected to complete on the bonds in December, now it’s looking like February,” said one official.

In spite of indications that government negotiators were poised to postpone talks until after the holidays, Charles Dallara, head of the consortium of financial institutions negotiating with the Greek government, said bondholders hoped to resume discussion soon. Negotiators said talks could restart as early as tomorrow in Paris.
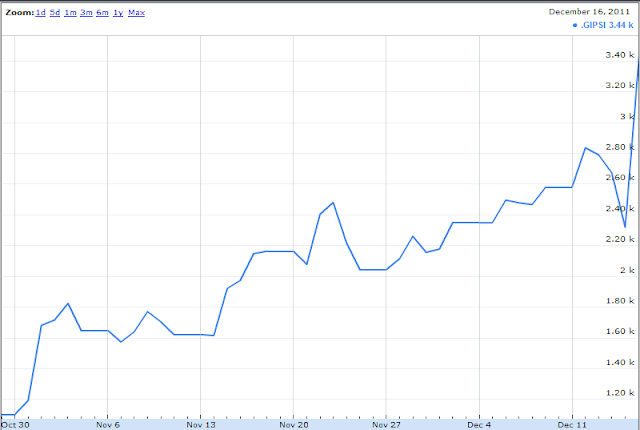
As I suggested before, it very well could be that there have been bad quotes for either the PIIGS or Greek CDS, or both. One would've expected a move like this to spill over into other asset classes, but stocks, forex, and commodities have all been rather sanguine the past two days. We should find out at the beginning of next week as to whether or not something big is brewing here or if this is just all smoke and no fire.

Thursday, December 15, 2011

Today's Major Market Move: Lumber Futures Gain 4.1% Month To Date in December

The fact that Lumber Futures have gained 4.1% so far in December is not particularly remarkable but what is noteworthy is the fact that every other commodity besides Lumber is down. Silver Futures are down by 10%. Nat Gas Futures have dropped over 12% and are well on their way to a 3 handle. Here are the December top decliners in the commodities space:

Click here to go to the live table.

It's not just commodities; we're seeing deflation in equities and forex as well. Perhaps that's where the "De" in December comes from. Of the 120 currencies that we track, 97 are flat or weaker against the Dollar (81%). Of the 321 global equity indexes we track, 287 are flat or in the red (89%), and as we've already mentioned, 28 of the 29 commodities we track are down (97%).

The most important take away from all of this is the fact that both WTI and Brent Crude were down over 6%. This means there's more room for the Central Banks to provide liquidity. Be prepared for more action (or at the very least, proposed action) by the CBs over the coming days and weeks.

Wednesday, December 14, 2011

Today's Major Market Move: Silver Futures Drop 5.9%

The European crisis instigated another risk-off day in the commodities complex with many of them down big and the top losers all being energy and pm related. Silver futures were hit the hardest with a one day 5.9% drop and are now 40% off of the 2011 highs. Natural Gas futures, aka "the Widowmaker" on account of how many traders who have been blown up by it betting big on higher prices, was down 4.4% and is on the verge of a 2 handle. Here's the list of the top losers:

Click here to go to the live table.
WTI Crude futures, a commodity we like to focus on in this blog, dropped over $5 all the way back down to $95. Here we witness the same old story where anytime WTI breaches the psychologically important $100 level, the Fed and its proxy, the ECB, take a break from the stimulus and bailout talk until they are given some breathing room. The Fed announcement yesterday was considered a disappointment by those looking for more easing and a few hours later the Germans poured cold water on continued one-off solutions by the ECB.

It is interesting how on a day like today, with continued pessimism surrounding the European economies, the market reacts much more negatively towards commodities than European equity indexes. The worst performing European equity index, the Dutch Amsterdam Midkap Index, fell just 3.4%. Here's the top 10 worst performing equity indexes:

Click here to go to the live table.

Tuesday, December 13, 2011

Today's Major Market Move: China's Stock Market Drops 23% Since May

Let's go ahead and boil this down. The Chinese benchmark equity index, the Shanghai SE Composite, is down 23% since May 1. On the 'plus' side, 40% of global equity markets have fared worse, some like Greece and Cyprus have fared much worse. On the minus side, the Shanghai SE composite is plumbing the 2011 lows:

Click here to go to the live chart.

and the China decoupling theory is being seriously tested:

Click here to go to the live chart.

If anything China is decoupling the wrong way; for the year the S&P 500 is only down 3% and the FTSE down 9% whereas the Shanghai SE is down over 20%. This article from indiainfoline.com starts out by stating that debt crisis fears in Europe are driving Asian (including China of course) markets lower. However one would think that equity markets in countries closer to the epicenter of the crisis (e.g. Germany and the U.K.) would be more severely impacted than a country much further away like China. There must be something else going on directly in China to account for the relative poor performance of its equity market. The same article touches on the reason a few paragraphs later. The housing bubble in China has started to deflate.
Realty developers in China tumbled the most after the Centaline property agency reported that Housing sales in China's first- and second-tier cities saw marked declines this year after the government limited purchases, banned mortgage loans for third homes and raised lending rates to cool the once-hot property market.

The housing sales in first-tier cities like Beijing, Shanghai, Shenzhen and Guangzhou, declined 20% averagely in November. The main property developers reported that the monthly sales revenue declined at least 20%. The Shanghai-listed Poly Real Estate saw sales revenue decreased 27.86% while the China Overseas Property reported sales revenue plummeted 49% in November.
I've long been of the opinion that when comparing the current economic downturn (and I'm including all of 2008 until now) to the Great Depression, China (now) = U.S. (then) and U.S. (now) = U.K. (then). Bear in mind that although the U.S. had tremendous growth potential ahead of it in the 1930s, it suffered greatly during the downturn. China's current great growth story will eventually resume its upward trajectory, but not without a significant dip of indeterminate length and possible political upheaval in the meantime.

Monday, December 12, 2011

Today's Major Market Move: Indian Rupee Weakens 20% vs US Dollar Since August

The President of the US has made it a prerogative to expand American exports to help boost the struggling economy. The Federal Reserve has joined in on this effort by attempting to weaken the dollar through low interest rates and otherwise expanding dollar liquidity. Here's an extract from a recent missive describing the progress of president's program, called the National Export Initiative:
These agreements also support the President’s National Export Initiative launched in 2010, with the goal of doubling U.S. exports by 2014.  Over 60% of exports are manufactured goods, and exports support over one quarter of all U.S. manufacturing jobs.  The initiative is on track to reach that goal, and has already helped U.S. businesses expand exports 17 percent in 2010 and 16 percent so far this year.
According to the president progress has been made on this front but it would be interesting to see a more detailed breakdown of the numbers. I would argue that the trade deficit would be a more import figure to look at since that is truer indication of how much money is leaving the country. From that vantage point the program has been less successful, with the trade deficit sitting at 34 billion in January 2010 and has been above that level every month since then. You can view the data going back to 2003 here.

What does all this have to do with the Rupee? One avenue for making a country's exports more attractive involves currency depreciation. The Japanese and the Chinese have been using this tactic overtly for years. Lately it's been happening with the other up-and-coming global competitive nations, such as the remaining BRICs (Brazil, Russia and India). Since 8/1 the Brazilian Real has weakened 17%, the Russian Ruble 14% and the aforementioned Indian Rupee 20%. Granted China's currency appreciated during that time, but only a measly .3% and only under continuing heavy political pressure from the U.S. Here's the list of the worst performing currencies vs the U.S. Dollar since Aug 1:

Click here to go to the live table.

These currency battles are a dangerous balancing act. There is an obvious beneficial aspect to cheaper exports but an administration has to deftly gauge how much a population can tolerate higher commodity prices. We in the U.S. are uncomfortable with $100/barrel oil but imagine the sentiment in India where the base commodity price is currently another 20% higher. Futhermore a government and central bank have to take special care that things don't get out of hand and they all of a sudden end up like Belarus:

Click here to go to the live chart.

Sunday, December 11, 2011

Today's Major Market Move: HNX Equity Index in Vietnam declines 45% in 2011

That paragon of capitalism, Vietnam, has not one main stock market, but two. One is located in Ho Chi Minh City (the eponymous Ho Chi Min Stock Index, the larger of the two) and the other is in Hanoi City (the HNX Index). The HNX Index has the distinction of being the 5th worst performing global equity index in 2011 (of the indexes that we track). Here's the bottom 10:


It is worth noting that the Ho Chi Minh Index is down only half of that (-22.8% vs -45.9%). I was unsuccessful in my research to find information to account for the significant difference in the amount of the declines. Part of the reason for the overall negative direction of both indexes appears to be both fiscal and monetary mismanagement by government authorities. From a monetary perspective, inflation (around 13%) and interest rates are high making it difficult for business to expand. General fiscal management is negative but there are some bright spots. Debt to GDP is still a manageable 52% but they've run a budget deficit 10 out of 12 years going back to 1998. The deficit spiked to 7.7% in 2010 although they were able to bring that down to a more manageable, but still relatively high, 3% in 2011.

In terms of growth, there are high expectations being placed on the Vietnamese economy with the IMF projecting GDP to grow by over 60% for the time range 2010-2015. Vietnam would only be behind Cambodia in terms of expected GDP growth in Southeast Asia. Here's a comparison of countries in the region:

Saturday, December 10, 2011

Today's Major Market Move: Syrian Pound Weakens 9.5% Against the US Dollar in December

The economic sanctions that have been imposed on Syria because of the regime's response to protests have begun to be reflected in the official exchange rate. I say official because the effects have already been felt for some time on the black market where the exchange rate is $1/S£60 (vs the current official rate of $1/S£54). The  9.5% rise in the official rate since Dec 1 makes the Syrian Pound the worst performing currency so far this month.

Click here to go to the live table.
For the year the Syrian Pound has weakened 14.9% which considering the circumstances, is a relatively moderate decline. They are the ninth worst performing currency, and none of those other eight countries are dealing with economic sanctions. Here's the list of the worst performers for 2011:

Click here to go to the live table.
According to a quoted analyst in this article from the Financial Times, the official rate has to get to 60 before the government is going to intervene.
Ayham Kamel of Eurasia, a consulting group, suggests that a rate of S£60 to the dollar, while pushing up prices of imported goods, is unlikely to be considered unacceptably high by the regime.

Mr Kamel points to the fact that the rate was around the $1/S£60 level the last time Syria was under intense international pressure following the assassination of Rafik Hariri, the then Lebanese prime minister, in 2005. “That’s within a reasonable range, given the pressure Syria is under,” says Mr Kamel. “From their perspective this is more of a long-term challenge, so they would like to preserve foreign reserves and intervene at a different time.”

Although analysts say devaluation is not yet a runaway phenomenon, the pound is expected to continue declining.

If it continues to decline at the same rate as the past week, the USDSYP cross will get to 60 well before the end of the year.

Click here to go to the live chart.