Tuesday, August 16, 2011

Do Wars Create Economic Prosperity?

Time and again I've heard Keynesians and other pro-stimulus minded folks cite World War II as the penutlitmate example of the benefits of unrestricted government spending. They also claim that it is proof that it doesn't matter what the money is spent on, it just needs to be spent period. Paying someone to build a bomb and then exploding it is not much different that paying someone to dig a hole for no particular reason.

Here's the latest version of this argument from, no surprise here, Paul Krugman: "Oh! What a lovely war!".
World War II is the great natural experiment in the effects of large increases in government spending, and as such has always served as an important positive example for those of us who favor an activist approach to a depressed economy. Christy Romer is very much on the same wavelength.
WW II has to be the absolute worst case study to use to argue for any course of action in dealing with economic downturns. The conditions existing for the U.S. during and after the war were so singularly unique that it completely voids using that event as an example for what should or shouldn't be done today, or during any other economic crisis.

The infrastructure and productive capabilities of almost every advanced economy, BESIDES the U.S., had been either completely destroyed or significantly harmed. This is the key take away from that event. Futhermore, not only were our major global competitors incapacitated, they became massive consumers of U.S. goods and services for the next 10-20 years following the war. The economic conditions for the U.S. were so preferential that it was impossible for even the politicians and economists to screw things up.

In fact I would argue that the benefits of the post World War II environment lasted all the way up until the next century, some 50 years later. It was at that point when all of the major global competitors had finally caught back up: first Germany, then Japan and finally China. Now that the competitive advantages have been erased, the U.S. has resorted to massive deficit spending to maintain the status quo and the same quality of life for its citizens. That cannot go on forever, and it won't.

So Mr Krugman, what the U.S. needs is not just any old garden variety war. We need one that is tailored specifically to wipe out the productive capabilities of the rest of the world while leaving ours intact (with us now being in the nuclear age, good luck with that one).

Thursday, August 11, 2011

Today's Major Market Move - Swiss Franc Weakens Over 5% vs. the US Dollar in Today's Session

There was some big news out of Switzerland today when the Swiss National Bank announced that it was considering pegging the Franc to the Euro. Because of the strength of the Franc, Swiss companies that depend on foreigners for sales must be screaming bloody murder. So the SNB is firing away in the dark hoping to 'hit' some kind solution and this is their latest pot shot. It did have an immediate effect, weakening the Franc vs the US Dollar by over 5% and vs the Euro by over 6%. The only currency that weakened more vs the USD today was the most less globally watched Malawi Kwacha.

Click on the table for a larger view.
Click here to view the table with the most recent data.


So the SNB managed to generate a short term spike in the foreign exchange markets which is not particularly hard for a central bank to do in these days of extreme volatility. But will the trend continue and for how long? The SNB has a long ways to go to get the Franc back to levels seen at the beginning of the year.

Click on the chart for a larger view.
Click here to view the chart with the most recent data.


And an even longer ways to go to get it back to the levels seen back in May 2010 when the SNB attempted it's first of what was to be several interventions (the USDCHF was trading at 1.44) . This was discussed in this post back on June 6.

In this post on Aug 2, we discussed how there was a strong correlation between the strengthening Franc and the declining Swiss equity market. Here's an update of the line chart that compares the USDCHF with several Swiss equity indexes.

Click on the chart for a larger view.
Click here to view the chart with the most recent data.


One can see how on the right side of the chart, the equity indexes started moving back up in tandem with the weakening Franc. But to be fair, the Swiss stock market would have most likely been up strongly regardless of the intervention since stock markets around the world were rallying (e.g. the DOW in the U.S. was up 423).

Wednesday, August 10, 2011

Today's Major Market Move - KBW Bank Index (U.S. Equity Index) Down 8.7% in Today's Session

Today was another big down day for global equity indexes and the U.S stock market in particular. The worst hit of the U.S. equity indexes we track was the KBW Bank index, which fell 8.7% in today's trading session. Of the top 15 worst performers today in the S&P 500, 7 of them are components of the KBW index (including the worst performer ZION, which was down 11%).

Click on the image for a larger view.
Click here to view the above table with the most recent data.


The bank stocks have suffered significantly more compared to the equity market in general. Here's a chart (y axis is in terms of % change) of the major U.S. equity indexes and the KBW Bank index.

Click on the image for a larger view.
Click here to view the above chart with the most recent data.


Bank of America has been in the news a lot lately with rumors circulating that the bank is in desperate need for capital. BAC continues to deal with losses from assets received as a result of the Countrywide acquisition and also faces the thread of a major payout from mortgage fraud litigation. At the behest of Bruce Berowitz (head of Fairholme funds which is BAC's largest shareholder) CEO Brian Moynihan held a conference call today with the bank's major investors. Presumably the intent was to reassure everyone that the bank was on solid footing and had a sound plan for dealing with current uncertainties. If that was in fact the intent, then the call would have to be considered a failure with BAC dropping almost 11% while the broader market was down a little under 5%. It's looking more and more that instead of BAC jumping into the water to save a drowning Countrywide, Countrywide is now pulling BAC under the water with it.

There is now another rumor floating around that BAC is considering selling off half its stake in China Construction Bank for around $9 billion. From Reuters:
The bank, the largest in the US by assets, is likely to sell half its stake in order to shore up its Tier 1 capital. Analysts believe Bank of America needs about $50 billion to meet new capital requirements.

Talks about the Chinese bank have been held with other investors in addition to the Kuwait Investment Authority and the Qatar Investment Authority, the sources said.

It is unclear if any agreement with the sovereign wealth funds or other investors have been cemented.

Tuesday, August 9, 2011

Today's Major Market Move - Gold Futures Up 16.8% in Past 30 Days

Not surprisingly with all the recent drama in global equity and bond markets, Gold has been the best performing commodity over the past 30 days, gaining 16.7%. Gold is now at new all time nominal highs and getting very close to the high in real terms reached in 1980.

Click on the image for a larger view.
Click here to view the above table with the most recent data.

From StockTwits, here's a chart of gold in real terms going back to 1968 (along with the Swiss Franc using a trade-weighted index):

Click on the image for a larger view.

Anyone who's long gold might be getting worried that this move might be parabolic in nature and a set up for a big drop. But if you look at a chart comparison of gold vs silver, it will become evident that the current move in gold is much more measured.

Click on the image for a larger view.
Click here to view the above chart with the most recent data.

Silver spike 50% from the beginning of March to the end of April while over the past 2 months gold is up about 20%. Of course there is always the risk that we enter a "Sell everything..." mode where banks and other institutions scramble for cash with everything and anything they have, including gold. This is essentially what happened at the end of 2008 when gold dropped from $980/oz to $670/oz.

Monday, August 8, 2011

Today's Major Market Move - Poland's Stock Market Down 27.6% in the Past 30 Days

The majority of the equity markets around the world have had a rough past 30 days and the most beaten down market over that time frame is Cyprus which is down 33.8% since 7/10. We've previously featured the Cypriot economy in our Major Market Move posts many times before (here, here, here and here) so we're going to take at the country with next hardest hit equity index, Poland.

Click on the image for a larger view.
Click here to view the above table with the most recent data.

The Polish Equity Indexes WSE sWIG80 and WSE mWIG40 (which I believe are the small and mid cap equity indexes) are down 27.6% and 26.6% respectively. The more broad based WSE WIG Index is down 23.3% Here's a chart comparison of the Polish Equity Indexes that we track.

Click on the image for a larger view.
Click here to view the above chart with the most recent data.

The equity decline has been happening despite the weakening of the Polish Zloty over the last 3 months. The USDPLN (US Dollar / Polish Zloty cross) has gone from 2.65 at the beginning of May to a current value of 3.00. It is now approaching the levels it was at back in January when there was some major uncertainty surrounding the eastern European economies and their level of both public and private indebtedness. Here's a chart of the % moves of several currencies from that region.

Click on the image for a larger view.
Click here to view the above chart with the most recent data.

Almost all of those currencies saw a decent amount of strengthening since January but are now quickly softening again back to the January levels. We didn't even include the Belarusian Ruble, which back in June was devalued by their central bank to the tune of 66%.

Many EU banks have issued a not-insignificant amount of loans to the peripheral European economies. If those same EU banks are having issues with public and private debt within the union (see SocGen and UniCredit), then there would be even less of a likelihood of those eastern European loans being paid back at par.

Friday, August 5, 2011

Today's Major Market Move - Finnish Stock Market Down Over 21% for the Month

There has been much carnage on the equity market landscape this past month and the usual suspects of Greece, Italy, Portugal, Spain and Cyprus were all down at least 15%. But today we'd like to discuss the Finnish market which hasn't received as much attention. The three Finnish equity indexes that we track, the OMX Helsinki 25 Index, the OMXHCap and the OMX Helsinki Index were all down over 21%. All 3 were in the top 5 decliners of global equity indexes.

Click on the image for a larger view.
Click here to view the table with the most recent data.

We talked about Finland's stock market in a recent post back on July 20th. In the post we pointed out how Nokia represented a large proportion of the total market cap of the Finnish market.
Nokia plays a very large role in the economy of Finland; it is by far the largest Finnish company, accounting for about a third of the market capitalization of the Helsinki Stock Exchange (OMX Helsinki) as of 2007, a unique situation for an industrialized country.[12] It is an important employer in Finland and several small companies have grown into large ones as its partners and subcontractors.[13] Nokia increased Finland's GDP by more than 1.5% in 1999 alone. In 2004 Nokia's share of the Finnish GDP was 3.5% and accounted for almost a quarter of Finland's exports in 2003.[14]

As most people are already aware, Nokia has been rapidly losing market share in the mobile device space. According to Gartner, Nokia's share declined a staggering 5% YOY from Q12010 to Q12011. With the increasing popularity of the Android and iPhone platforms, it doesn't look like that trend is going to reverse itself anytime soon.

The outlook for Finland over the longer term is also pessimistic. According to the IMF, Finland's real gdp is estimated to grow only 15% over the next 5 years, lowest in the Scandinavian and Baltic regions.

Click on the image for a larger view.
Click here for a live version of the above chart.
(Please be patient, the chart takes about a minute to load.)

Thursday, August 4, 2011

Today's Major Market Move - U.S. Based Oil Service Sector Index Declines 8.6% in Today's Session

Stock markets around the world had a rough go of it today with many indexes declining more than 5%. The U.S. market was no exception with the DJIA, S&P 500 and Nasdaq down 4.3%, 4.8% and 5.1% respectively. However the hardest hit of the indexes that we track was the Oil Service Sector Index which finished the day down 8.6%. Oil service company stock prices were getting hit from two directions with both equities and oil getting sold hard.

Click on the image for a larger view.
Click here to see the table using the most recent data.

Here's a breakdown of the individual components of the index. All of them were down at least 5% with Global Industries (GLBL) getting hit the hardest dropping 12.55%

Click on the image for a larger view.
Click here to see the table using the most recent data.

As previously mentioned, oil was also down today with Brent declining 5.1% and WTI down 6.2%. Not surprisingly, the Oil Service Sector Index has tracked the price of oil (particularly WTI) reasonably closely this year.

Click on the image for a larger view.
Click here to see the chart using the most recent data.

I'm not so sure about bailing out of oil right now, and I especially wouldn't be shorting it. Many folks are anticipating some action from the Fed in the near future, perhaps QE3 or a cap on certain treasury rates. From the time when QE1 was announced to when QE1 ended WTI Crude prices went from $49 to $87. For the smaller QE2 the oil price from announcement to end was $83 to $97. (sources: Caluclated Risk QE Timeline and US Energy Information Administration).

Wednesday, August 3, 2011

Today's Major Market Move - Japanese Yen Weakens 2% vs. the US $ in Past 24 Hours

The Japanese Central Bank finally followed through with their recent threats and intervened in the currency markets today to weaken the Yen. Here's a summary from Marketwatch:
HONG KONG (MarketWatch) — The Japanese government intervened in the foreign-exchange markets Thursday to curb the yen’s strength, prompting a sharp pullback in the local unit against all major currencies.

The intervention was confirmed by authorities, with the Bank of Japan saying the Ministry of Finance’s action “will contribute to stable price formation in the market.”
Looking at the chart, the pullback appears to be about as sharp as a butter knife. For a single day it's a fairly sizable move but the cross still has a ways to go to just get back to where it was at the beginning of July.

Click on the image for a larger view.
Click here to see the same chart with the most recent data.

The JCB isn't the only central bank to recently attempt to guide the markets. The Swiss Central Bank intervened a few hours earlier but got only a 1.3% boost for their efforts. Just this past Tuesday, we posted about how the strengthening Franc was creating problems for Swiss exports and that was being reflected in their stock market. Here's an excerpt:
One group of people that is not particularly happy with this trend are the members of the Swiss National Bank, although they appeared to have learned from back in 2009/2010 that resistance (i.e. intervention) is futile.
Ooops, we goofed. It appears that the SNB has in fact NOT learned its lesson and it will be interesting to see how much money SNB head Hildebrand will lose this time around. Lets see if they can top the Sfr21 billion from 2010.

On the other side of the spectrum, we have Turkey who is trying to prevent their currency from weakening further. With overnight lending rates sitting at 1.5%, raising interest rates would appear to be the obvious option. However according to this article from the Hurriyet Daily News, the central bank is exploring other avenues.
In order to prevent the Turkish Lira from sliding further, several experts are voicing their opinion of what type of precautionary measures Turkey’s Central Bank may choose to execute.

Özgür Altuğ, chief economist at BGC Partners, wrote in a short note to investors that the Bank could switch to a different monetary policy scenario and introduce a series of measures.

The Central Bank might, among others, decide on a hike in its overnight borrowing rate, which was reduced sharply from above 6 percent to 1.5 percent in the fourth quarter of 2010, in order to attract short-term foreign capital inflows to limit the depreciation of the lira, Altuğ said. Other measures could be a cut in foreign exchange required reserve ratio to support the foreign exchange liquidity of the system and banks’ lending capacity and the introduction of daily foreign exchange selling auctions, he added.
I believe I have the reason for why the Turkish Central Bank is interested in pursuing other courses of action besides raising rates. It's this:

Click on the image for a larger view.
Click here to see the same chart with the most recent data.

The blue line is the USDTRY (US $ / Turkish Lira cross), the red line is one of the main Turkish equity indexes and the y axis is in terms of % change. That chart has to represent a central banker's worst nightmare: a currency that is weakening at the same time that equity markets are declining. It's a financial Sophie's Choice; protect the currency at the risk of crashing the stock market or allow the currency to continue to weaken in an attempt to provide support to equity investors? This one's going to be interesting to watch.

Tuesday, August 2, 2011

Today's Major Market Move - Swiss Equity Market Declines Over 4% in Today's Trading Session

Now that the U.S. has successfully forestalled the debt default that no one in their right mind thought was going to happen to begin with, the doom-and-gloomers have refocused their attention to Europe. European equity markets took it on the chin earlier today with the Swiss market seeing the worst of it by dropping 4.7%. The following table shows the top 13 global equity index decliners in the past 24 hours.

Click on the image for a larger view.
Click here to view the table with the most recent data.


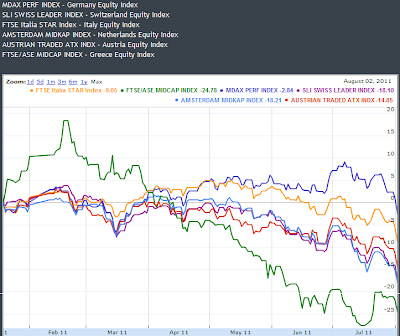
Europe is well represented in that table. Many of those indexes have collapsed through their 2011 lows, even after the bounce from Greece Bailout 2.0. I've taken several of those equity indexes and put them in the following line chart. The right axis is in terms of % gains/losses.

Click on the image for a larger view.
Click here to view the chart with the most recent data.


Further weighing on the Swiss equity markets is the strengthening Franc, which we discussed in a post last Tuesday. The following chart shows the high correlation between the Swiss currency and the Swiss equity indexes.

Click on the image for a larger view.
Click here to view the chart with the most recent data.


The Greek bailout has not had the desired effect of stemming the contagion. Italian and Spanish bond prices hit new highs today and eventually both Italy and Spain will require bailouts as well. From Reuters:

Yields on 10-year Italian and Spanish debt rose sharply on Tuesday, surpassing recent peaks to reach their highest since 1997, while the risk premium over German debt on both countries' bonds hit the highest since the launch of the euro.

Five-year Italian yields rose to hit parity with their Spanish equivalent in a sign that the once-resilient confidence in Italian finances had been seriously eroded.

Analysts expected those borrowing costs to keep rising, potentially providing for a tricky backdrop to a sale of Spanish debt later this week.

"In the near term, I am struggling to see any signs that the EU or the Italian and Spanish politicians are ready to offer something up to calm the markets and so by no means would I be assuming that we have seen the highs for BTP and Spanish yields already," said John Davies, fixed income strategist at WestLB.

Monday, August 1, 2011

Today's Major Market Move - Lumber Futures Down Over 10% in the Past Week

Commodities in general were down last week as the "Risk Off" sentiment dominated the market mind set. All of the uncertainty surrounding the debt drama resulted in many investors searching for safety although how many people really,truly believed that a deal was not going to get worked out in time? The worst performer in the commodity sector (of the 29 commodity futures that we track) over the last 5 trading days was Lumber, dropping 10.6%.


Click on the image for a larger view.
Click here to go to the table with the most recent data.

For the year, lumber is now quickly approaching its previous low of 219. Only one commodity has performed worse this year: cotton. Here's a chart of the top 5 commodities in terms of price declines since January.


Click on the image for a larger view.
Click here to go to the chart with the most recent data.

It would be natural to try to draw a correlation between lumber prices and homebuilder activity. In my opinion, the best homebuilding metric to use would be housing starts, however the best chart I could find is the one below from Calculated Risk. The data is graphed over a much longer time frame so it can't really be used for comparison.


Click on the image for a larger view.
Here is a link to the source chart.

We are working on collecting various homebuilding metrics as well as the homebuilder ETF, XHB. We hope to have this set up over the next couple weeks and once that happens we'll be able to provide a comparison with lumber prices in a single chart.