Friday, June 29, 2012

Today's Major Market Move: WTI Curde Oil Gains over 8% During Friday's Session

On Friday there was a ubiquitous mindset of "risk-on" and in a very big way. Fueled by the announcement that the rules that govern how the ECB can recapitalize banks would be relaxed, equities and commodities around the globe surged. The biggest move in the commodities space was seen in WTI Crude which gained over 8% in one day and finished over $84/barrel. Here's the top 10 commodity gainers on Friday:

Click here to go to the live table.

We had discussed Brent Crude back on June 21 after it had dropped through the 2012 lows. We closed that post with the following statement:
With the recent drop in oil prices, the anti-inflationist stance by the Germans will become even harder to maintain. We would not be surprised to hear the announcement of some type of major liquidity program out of the ECB before the end of the month.
We wouldn't consider our wording strong enough to call the above statement a prediction, but let's just say our 'suspicion' was confirmed on the last trading day before the end-of-the-month deadline. As we had surmised, in the face of rapidly dropping commodity prices (most notably oil), Germany's anti-bailout and anti-inflationary stance would prove to be untenable. Merkel is now in the process of trying to save face after her reversal. This is from the Business Mirror:
Chancellor Angela Merkel defended concessions she made at a European Union summit, telling German lawmakers on Friday that help to struggling countries and banks will still come with strings attached and insisting that some decisions were misunderstood.
Merkel had been opposed, at least in the near term, to some of the measures that she and the other 16 leaders of the euro countries agreed on Friday. They include allowing Europe’s bailout fund in future to give money directly to a country’s banks, without imposing strict austerity conditions on the government.
German media headlines immediately after the summit portrayed the outcome as a political defeat, but Merkel said her tough-love approach was intact.
The net effect on the Euro currency turned out to be mildly positive with the perceived stabilization of the PIIGS financial sectors outweighing the inflationary impact of the new measures. The Euro strengthened 1.6% on the day but still sits close to the lows of 2012:

Click here to go to the live chart.


Thursday, June 28, 2012

Today's Major Market Move: Japanese TSE Mothers Index Gains 18.4% in June

The Japanese TSE Mothers equity index gained 18.4% in June making it the second best performing equity index for the month behind the Greek FTSE/ASE Midcap Index. It's been a decent month for global equities with 137 indexes out of the 312 that we track (57%) sitting in positive territory. Here's the top 10 performers for the month of June:

Click here to go to the live table.
In general Japanese equities performed reasonably well with many indexes having posted a monthly gain so far in the vicinity of 7% and the benchmark Nikkei 225 index up over 5%. The TSE Mothers index is comprised of high growth / high risk companies so its moves are typically amplified. Even with the positive monthly gain, Japanese equities remained mired in the same long term channel that goes back to the end of 2008. Below is a chart of the cumulative growth of a sampling of 7 Japanese equity indexes compared alongside cumulative GDP growth (both actual and estimated).

Click here to go to the live chart.
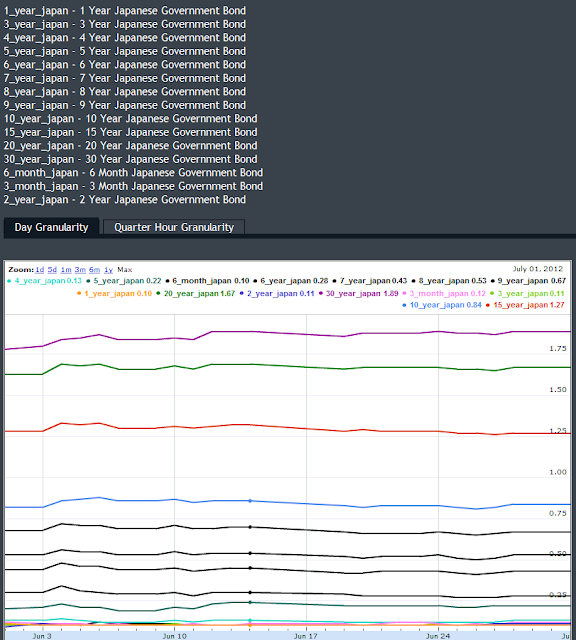
Taking a look a Japanese Government Bonds, yields have come up slightly on the long end while remaining flat in the middle and at the short end. Japanese authorities continue to struggle with generating sustained inflation.

Click here to go to the live chart.
Moving over to the currency, the Yen has weakened recently, which no doubt was part of the impetus for the equity gains. The USDJPY has been fluctuating around the 80 level for approximately the past year and a half.

Click here to go to the live chart.


Wednesday, June 27, 2012

Today's Major Market Move: Cypriot Stock Market Drops 4.9% in Wednesday's Session

The worst performing stock market for Wednesday's session was the already beaten down Cypriot stock market which dropped 4.9% on the day. Equities in Cyprus are down over 87% since the beginning of 2011 and despite the recent positive news coming out of it's close neighbor Greece, are threatening to break through the lows of 2012.

Click here to go to the live chart.
The majority of equity markets were in the black on Wednesday with close to 80% of the equity indexes we track finishing in positive territory. The reason for Cyprus bucking this trend, and by such a large extent (4.9%), was the news that the troika (EU,ECB &IMF) had accepted a bailout request made by Cypriot authorities. Here's some more color from Fox news:
[Cypriot Finance Minister] Vassos Shiarly noted that the eurozone group of nations had accepted on Wednesday Cyprus' request for financial aid. He said experts from the so-called 'troika' will carry out an in-depth study into the Cypriot banking system and economy to calculate how much the country will need. He told a news conference that the study will take about a month.

The eurozone welcomed Cyprus' request for financial aid, saying that it is confident negotiated austerity measures "would address the financial, fiscal and structural challenges of the economy in a decisive manner and should allow Cyprus to return a sustainable growth path." In Washington, IMF chief Christine Lagarde said the fund is ready to join its European partners to help Cyprus return to stable economic growth and restore its banking sector.

Shiarly played down concerns that the EU bailout fund will require the kind of punishing wage cuts, job losses and tax increases that Greece had to swallow in exchange for €240 billion ($300 billion) in bailout money.
The last paragraph explains why the stock market reacted in such a strong negative fashion to what on the surface might appear to be positive news. Modest GDP growth is being predicted by the IMF for the next 3 years although stock market investors don't appear to be convinced.

Click here to go to the live chart.

Thursday, June 21, 2012

Today's Major Market Move: Brent Crude Drops 2.4% in Thursday's Session

Thursday was rough day for inflation correlated assets with the majority of equity indexes in the red (254 out of the 312 that we track) and commodities getting hard as well, particularly energy and precious metals. Brent Crude dropped 2.4% on the day and has now broken through the 2011 lows. Brent was trading at $126/barrel back in mid-March but since then has seen a remarkable 29% decline. Here's the line chart going back to the beginning of 2011:

Click here to go to the chart.
The market is expressing a lot of faith that the Germans are going to be able to hold the ECB at bay. Yes, the Euro has weakened against the Dollar in 2012 but only to the tune of 2.7%, just a small portion of the decline seen in oil prices. Here's the USDEUR cross alongside Brent front month futures contracts in % terms starting at the beginning of 2012:

Click here to go to the live chart.
The market displayed some disappointment at the Fed announcement yesterday when US equities closed in the red. Many participants were hoping for more aggressive action beyond the mere extension of 'Operation Twist'. If US equities were to move aggressively southward and WTI remains below $90 / barrel, we feel safe in predicting further market intervention by the Federal Reserve. However in the near term most eyes will continue to be focused on Europe and the ECB. With the recent drop in oil prices, the anti-inflationist stance by the Germans will become even harder to maintain. We would not be surprised to hear the announcement of some type of major liquidity program out of the ECB before the end of the month.


Wednesday, June 20, 2012

Today's Major Market Move: J.C. Penney (ticker: JCP) Declines 9.2% Month To Date

Even with all of the recent volatility, June has been a decent month for the S&P 500 which as posted a 3.5% gain month to date. One stock that has bucked that overall upward trend has been J.C. Penney (ticker: JCP) which is down 9.2% for the month and 35% for the year. Here's the top 10 decliners in the S&P 500 for the month of June so far:


Click here to go to the live table.
After a solid beat in calendar Q4 2010, EPS has trended down over the past 5 quarters and calendar Q4 2011 was particularly abysmal. When looking at EPS actuals, the stock price has held up reasonably well.
Click here to go to the live chart.
As far as general retailers go in 2012, the problems are isolated to JCP. SHLD has been one of the best performers in the S&P 500 and CSCO, WMT and TGT all are putting in solid performances. Here's a comparison chart:

Click here to go to the live chart.
We're going to finish our post with a link to a video containing the always entertaining Howard Davidowitz who not-so-casually mentions that he predicted JCP's current misfortunes.

http://pricesignals.blogspot.com/2012/05/howard-davidowitz-on-jc-penneys.html


Tuesday, June 19, 2012

Today's Major Market Move: Malawian Kwacha Weakens 65% Year to Date

Many of the countries in central East Africa (Kenya, Tanzania, Uganda), were having issues with weakening currencies in the middle part of 2011. However since then, most of the countries have seen their currency situation improve. Malawi is an exception who continues to deal with serious inflation issues. The Kwacha has weakened 64% so far this year against the US Dollar, making it the second worst performing currency over that time frame.

Click here to go to the live table.
 Here's a refresher of what countries occupy the central east African region:

Click here to go to the region on Google Maps.
The Malawi had been maintaining a peg to the US Dollar but last month, with pressure from the IMF, the Malawian authorities removed the peg which triggered a 50% overnight devaluation. The peg had been maintained at 165 Kwacha to the Dollar but the black market rate was hovering around 270. Here's a line chart of the US Dollar/Kwacha cross going back to the beginning of 2011:

Click here to go to the live chart.
The currency move is part of an effort by a new administration to improve ties with the IMF and international donors. The previous president, Bingu wa Mutharika, had a contentious relationship with the international community due in part to an incident where government forces killed 20 civilian protestors. Mutharika died of a heart attack last month, opening the door for a new administration headed by President Joyce Banda who quickly started making moves to repair international relations. Here are some more details courtesy of Reuters:

The IMF had called for a 50 percent devaluation of the kwacha, which commercial banks were selling on Monday at 250 to the dollar - well above the former peg at 165 and close to the black market rate of about 275.

The Reserve Bank of Malawi said it did not expect the currency reform to stoke inflation, because most commodities were already being traded at the unofficial exchange rate.

"At 250 per dollar the exchange rate is well adjusted," the Reserve Bank of Malawi said in a statement.

"It should also, together with the liberalisation of the foreign exchange market, contribute to government's efforts to reach early agreement with the IMF, which should lead to unlocking donor flows in the next few months."

Former colonial master Britain and major aid donor the United States froze aid packages worth nearly $1 billion to a country with an annual GDP of around $5.6 billion.


Monday, June 18, 2012

Today's Major Market Move: Hungarian Forint Strengthens Over 5% Against Dollar in June

When we last focused on the Hungarian Forint back in January, the Hungarian authorities had announced at that time that they were willing to make concessions with the IMF and EU on a disputed central bank law as well as on some taxation related issues. Here we are 6 months later and the details are still being worked out. In fact, the IMF, the ECB and the EU won't even begin talks in earnest on the requested IMF aid until the changes have been implemented.

Over the previous 6 month time frame there has been some fairly significant volatility in the US Dollar / Forint cross, including a 5% move stronger so far in the month of June. Here's the line chart of the USDHUF cross going back to the beginning of 2012:

Click here to go to the live chart.
Here are some more details on recent developments provided by Bloomberg Businessweek:
The victory of pro-bailout parties in Greece reduces the chances of contagion in Europe and helps Hungary’s outlook for continued debt financing from the markets, Mihaly Varga, Hungary’s chief negotiator for an International Monetary Fund- led aid deal, told MR1 state radio today. The government has completed details of an amendment to a disputed central bank law, which may be acceptable to the Magyar Nemzeti Bank, and probably will be submitted to Parliament this week, Varga said.
“A serious obstacle to the bailout talks may actually be removed,” Levente Blaho and Adam Keszeg, analysts at Raiffeisen Bank International AG (RBI), wrote in a research report today. “The forint started the week on a month high, which was mainly to do with the Greek election news and also helped by the comments” from Varga, the Raiffeisen analysts added.
There remains a very tight inverse correlation between the USDHUF cross and the benchmark equity index, the Hungarian Traded Index:

Click here to go to the live chart.


Monday, June 11, 2012

Today's Major Market Move: Brazilian Real Weakens Over 3% in Monday's Session

It was almost a clean sweep for the US Doller on Monday with only 3 out of 117 currencies strengthening. Out of the 114 weakening currencies, there were several notable moves. The Uruguayan Peso, the Polish Zloty and the Brazilian Real all softened by more than 3%. Here's the top 10:

Click here to go to the live table.
We're going to focus on the Real for today's post since it has previously come up as the topic of our Major Market Move post a couple of times this year and also because we track Brazilian sovereign bonds. Looking at the bonds, we see that despite the currency move over the last three months, the yields have actually improved slightly:

Click here to go to the live chart.
And here's the Real over the same time frame:

Click here to go to the line chart.
The Brazilian central bank continues to try to control the decline, with mixed results according to this article from the WSJ:
The real weakened past the BRL2.03 mark in a swift reversal during mid-morning trade, luring the central bank from the sidelines with a dollar-swap auction. But the auction was far from a success, with the central bank selling $400 million worth of the $1 billion dollar-swap contracts it was prepared to sell. The real initially gained some ground against the dollar before falling back once again and weakening past the BRL2.04 mark.
The market did not like the terms set by the Brazilian central bank in the auction, Mr. Zotovici said. "The bank is going to need to lower the price of the dollar in its swaps if it wants to continue intervening," he said.
Dollar-swap auctions allow investors to exchange paper linked to domestic interest rates for contracts indexed to the U.S. dollar. The auctions are a tool to smooth volatility in the exchange market at times when the Brazilian real is weakening sharply against the dollar. Last week, the central bank sold a total of $2.02 billion in dollar swaps in two separate auctions.

Friday, June 8, 2012

Today's Major Market Move: Egyptian Stock Market Up 24% Year to Date

Even with all of the global economic turmoil, 2012 has been a decent year for equities (so far). 49 out of 90 benchmark equity indexes are in the green and the top performer, Venezuela, has seen it's stock market more than double. Here's the top 10 gainers in 2012 year to date:

Click here to go to the live table.

Bringing up a distant second place is the subject of today's Major Market Move post, the Egyptian stock market. The EGX 30 Index was actually up as much as 50% back at the beginning of March but has since fallen off to where it is now only up 24%.

Click here to go to the live chart.
The last time we discussed the Egyptian stock market was back on March 16. One big question mark facing the Egyptian economy at that time was when (or even if) a much needed loan agreement with the IMF would be successfully completed. Egypt was burning through its foreign currency reserves in order to prop up its currency. In that March 16th post we surmised that the Egyptian authorities would be very motivated to get a deal done sooner rather than later. Well here we are almost three months later and still no deal. Here's some color on the current state of the negotiations courtesy of the Daily Beast:
True, the government and the IMF are in advanced negotiations about a $3.2 billion loan to help Egypt avoid a disorderly devaluation. But the military’s refusal to allow the Brotherhood to form a government after its parliamentary victory led the latter to withhold support for the loan. The IMF is, in turn, refusing funds until it’s clear that the successor to the current military-appointed caretaker government will support the loan. Moreover, the IMF package is just a fraction of the $10 billion to $12 billion the Egyptian government and the IMF estimate the country will need to avoid a disorderly devaluation.
The Egyptian pound has managed to hold steady for the first half of the year (chart of USD / Egyptian Pound cross):

Click here to go to the live chart.
But the resilience of the currency is due in part to some accounting shenanigans. The following is from Al Araybia:
Egypt’s foreign reserves rose by $302 million in May, their second successive monthly increase, but the positive number may mask a continuing deterioration in Egypt’s finances, analysts and traders said.

Foreign reserves climbed to $15.52 billion at the end of May from $15.21 billion at end-April, the central bank said.

The reserves figure apparently includes $1 billion that the central bank received from a May 15 sale of dollar-denominated T-bills to local banks, money from that came from inside Egypt and does not represent an improvement in the balance of payments.
When the central bank receives funds from T-bill sales, it transfers them to the Ministry of Finance in Egyptian pounds while keeping the U.S. dollars as foreign reserves, a Cairo-based currency trader said.

This would indicate that without the $1 billion in dollar T-bills, reserves would have fallen by $700 million, traders and analysts said, a number that suggests Egypt continues to bleed from the political and economic turmoil of the last 18 months.

Reserves have tumbled by more than half since the popular uprising in early 2011 scared away tourists and investors, two of Egypt’s main sources of foreign currency.

Thursday, June 7, 2012

Today's Major Market Move: German 2 Year Yield Gains 6 Basis Points This Week

There hasn't been any concrete action (yet) but in the past few days the Fed has indicated it is standing ready to take action to support the markets . We are convinced that were it not for the $30 drop in the price of WTI, the Fed would've been much more tight lipped. Over the last few days there's been a decent bounce in yields in both of the primary safe haven assets: Bunds and Treasuries.

Here's the U.S. Yield curve:

Click here to go to the live chart.
And here's the Bund yield curve:

Click here to go to the live chart.

A little under a week ago we focused on the German 2 year whose yield had briefly dipped into negative territory. Since then, the yield has had a slight bounce to .07 but it sill remains at an extremely low level. Here's the line chart of the yield going back to the middle of February (it shows the daily high):

Click here to go to the live chart.

Wednesday, June 6, 2012

Today's Major Market Move: Ukrainian Stock Market Slides Over 7% in Wednesday's Session

It was a solid day for global equity markets with 71  out of 90 benchmark global equity indexes finishing either even or in the black. One of the unlucky 19 to finish in the red was the Ukrainian stock market which got slammed with a 7% one day decline. It was by far the biggest decliner on the day:

Click here to go to the live table.

We discussed Ukrainian equities several times last year (see our posts on Nov 29, 2011, Oct 22, 2011 and June 27, 2011). In those posts we discussed how the Ukrainian economy was one of the top beneficiaries of the services of the IMF. As we will see in this next chart, the IMF assistance has yet to bear much fruit.

Click here to go to the live chart.
Measuring from the beginning of 2008, cumulative GDP growth is essentially flat and equities are down well over 50%. Now one could always argue that the situation would be much worse were it not for the efforts of the IMF.

Tuesday, June 5, 2012

Today's Major Market Move: Soybean Meal Futures Gain 33% Year To Date

For the most part commodities are down in 2012 with several commodities having experienced over 20% declines in the first 5 months. The picture is by no means consistent however and on the other side of the spectrum we have soybean meal futures which have risen 33% so far in 2012, making it the top gainer. Here's the top 10 performing front month commodity futures contracts:

Click here to go to the live table.
It was a steep climb higher for soybean meal in the first 4 months but it's entered into a choppy pattern since then.

Click here to go to the live chart.
According to this article from Wisconsin AgConnection (published back at the beginning of May), contributing to higher prices are supply issues with farmers in Brazil. As far as animal feed is concerned, corn and soybean meal are often interchangeable. So while the two have moved in opposite directions in the first half of 2012, we would not be surprised to see them converge back towards each other as livestock farmers adjust.

Click here to go to the live chart.


Monday, June 4, 2012

Today's Major Market Move: Spanish Stock Market Drops 27% Year to Date

After managing to stay even for the first 3 and a half months of 2012, the Spanish stock market has been on a steady decline since then. The benchmark Spanish equity index, the IBEX 35, is down almost 28% over the last 2 and a half months. This moves it into third place for the worst performing benchmark equity indexes in 2012. Here's the top 10:

Click here to go to the live table.
Let's review our chart showing the performance of the PIIGS benchmark equity indexes going back to the beginning of 2011:

Click here to go to the live chart.
 Irish equities have managed to hold up reasonably well over the last year and a half while the remaining PIGS (+Cyprus) have all sunk to new lows. If we expand the time horizon back to 2007, the declines become even more pronounced.

Click here to go to the live chart.
The chart above has some aesthetic issues that we're working on adding functionality to clean up, but we don't think that these issues diminish the astounding nature of the data itself. To give these numbers some perspective, the total decline from peak to trough of the DOW during the Great Depression was about 85%. Cyprus and Greece are already beyond that figure and Italy is steadily approaching it. Portugal and Spain are not far behind.


Friday, June 1, 2012

Today's Major Market Move: German 2 Year Bond Briefly Goes Negative

If anyone is still doubting whether or not the bulk of the world is in inflation or deflation, the fact that the yield on the 2 year German bond went negative briefly on Friday ought to convert any last remaining holdouts. Here's a chart of the yield on the 2 year going back one week:

Click here to go to the live chart.
Let's also take a look at the entire German Bund yield curve:

Click here to go to the live chart.

A few things jump out from the above chart:
  1. The curve is inverted (and has been for some time) with the 30 year below the 20 year
  2. Every single duration is now well under 2%. 1.67% for a 30 year bond? All we can say is "wow".
  3. Yields have recently nose-dived from what was already historically low levels.
We expect to see some kind of action from the world's central banks in the very near future. With both oil and interest rates dropping like rocks, the central bankers have plenty of cushion for providing liquidity. The long term impact of all this extra money remains to be seen, but with the house currently on fire we highly doubt that Bernanke and co. are worried about any water damage that might result from the drenching to put the flames out.