Thursday, May 31, 2012

Today's Major Market Move: Oat Futures Decline Over 18% in May

Overall the commodities complex has gotten hammered in May with many front month commodities futures contracts seeing double digit declines. Oat futures have been one of the harder hit commodities with an 18.6% decline for the month, making it the third worst performer.

Click here to go to the live table.
The monthly decline in oats would have been even larger had there not been a 4.1% one day relief rally today. However even with today's action, Oat futures are now down over 26% since the beginning of 2011 and are now below the lows of the past 17 months.

Click here to go to the live chart.
The reasons for the decline appear to be twofold: 1) another flare up in the European crisis which has been driving down asset prices across the board, and 2) above average warm weather which has been driving down the prices of many of the agricultural commodities, particularly oats, cotton and FCOJ.

Wednesday, May 30, 2012

Today's Major Market Move: Venezuela's Stock Market Dips 12.4% in May

Buy the rumor sell the news? Some trading adages hold true even in the most bizarre of situations. As we've been following closely for the past year and a half, there's been the most amazing run up in Venezuelan equities, fueled for the most part by the notion (hope?) that Chavez's presidency (reign?) would come to an end sooner rather than later because of terminal cancer. It is what we've been referring to as the "Oncological Boom" which is even more remarkable considering it occurred within the larger context of a global economic crisis. Let's take a look at the chart of the benchmark Venezuelan equity index going back to the beginning of 2007:

Click here to go to the live chart.
The Venezuelan authorities haven't been particularly forthcoming about the extent of Senor Chavez's illness so the news that makes it to the rest of the world arrives in murky bits and pieces. Lately those morsels haven taken on a more grisly tone and it is now becoming more apparent that El Presidente won't be making a full recovery, as had once been indicated. The latest report comes courtesy of Dan Rather (yes, that Dan Rather):
“This reporter has been told that Venezuelan President Hugo Chavez has metastatic rhabdomyosarcoma, an aggressive cancer that has ‘entered the end stage.’  The information and the quote come from a highly respected source close to Chavez and who is in a position to know his medical condition and history. This source says the prognosis is dire and that Chavez is now not expected to live ‘more than a couple of months at most.’  Chavez is running for re-election in Venezuela but several sources--including the one who revealed the exact kind of cancer-- have told me that they believe it is doubtful the dictator will live to see the results.
The last time we commented on the Oncological Boom was back on April 27th, two days after Chavez had returned from Cuba for cancer treatments. The Venezuelan stock market peaked about a week after that and has since dropped about 12% from that peak. We would not be surprised if, upon Chavez's return, word leaked out to the Venezuelan investing community about his dire prognosis which caused a "sell the news" type reaction. Here's a blow up of the last month of the above chart:

Click here to go to the live chart.

Tuesday, May 29, 2012

Today's Major Market Move: Russian Ruble Weakens 10.6% Against US Dollar in May

With the turmoil surrounding Putin's election, a decline in crude oil prices and spillover from the resurgence of the European economic crisis, the Russian economy has suffered in May. Many Russian equity indexes are at new swing lows (going back to the beginning of January 2011) and the Ruble has declined over 10% against the US Dollar, making it the 4th worst performing currency this month.

Click here to go to the live table.
In terms of weakening currencies, the Ruble has plenty of company. As has been the pattern over the last 5 or so years, whenever the global economy hits a rough patch, there's a flight to US treasuries and a subsequent strengthening of the Dollar. Only two currencies have strengthened against the US Dollar in May, the Ugandan Shilling and ironically, the Japanese Yen. We say ironically because the one country that has (arguably) done more than any other country in an attempt to weaken its currency against the US Dollar sees the Yen strengthen when 99% of the rest of the world's currencies have weakened.

Going back to the Ruble, it is getting close to breaking out to new highs last seen at the beginning of 2012. Furthermore, the weakening currency is not having the beneficial effect on equities that we usually see. Here's a comparison chart of the Ruble vs. the Russian benchmark RTS Standard Index going back to January 2011:

Click here to go to the live chart.


Monday, May 28, 2012

Today's Major Market Move: Greek Stock Market Up 6.9% in Monday's Session

There were two news items to come out of Greece on Monday which resulted in a 6.9% one day boost to Greek Equities.  One event was the disbursement of 18 billion Euros to Greek banks courtesy of the ECB and the other was the improving poll numbers of the pro-bailout New Democracy party. A 6.9% one day gain is nothing to scoff at but Greek equities still have a long ways to go to show any signs of a real recovery. Here's the line chart of the benchmark FTSE/ASE 20 Index going back to the beginning of 2011:

Click here to go to the live chart.
Unfortunately for the rest of Europe there were no collateral gains. Most of the other European equity markets were flat and the Spanish market was down over 2%. Here's some more details on the recent happenings in Spain courtesy of The Times Live:
The premium investors require to hold Spanish government bonds over German counterparts hit a euro-era high at 505 basis points, denoting a lack of confidence in Madrid's efforts to stabilise its finances and ailing banks.
Having dropped to about 4.7% earlier this year, helped by the ECB's creation of a glut of three-year money, 10-year borrowing costs are now approaching 6.5% and closing in on the 7% level widely seen as unsustainable.
Ireland and Portugal were frozen out of capital markets and forced to seek international bailouts soon after their yields topped 7%.
We aren't yet tracking Spanish sovereign interest rates but the next best thing we can do is take a look a the Spanish sovereign 5 year CDS. Not surprisingly, it is also showing signs of stress as the price breaks out to a new high (higher CDS prices = higher perceived default risk).

Click here to go to the live chart.

Friday, May 25, 2012

Today's Major Market Move: Malawian Kwacha Weakens 55% Against US Dollar This Week

Does a 50%+ overnight devaluation count as hyperinflation? We can't say for sure that it does but we do feel safe saying that after this week, many Malawians are less likely to be storing their life's savings in Malawian Kwachas. The official rate for the USDMWK cross jumped from 173 to 259 (50%) on Thursday and was up another 5% today.

Click here to go to the live chart.
Bear in mind this is the 'official rate'. As we've learned with Syria and Myanmar, the de facto rate tends to be much worse. The ripple effect from this latest round of turmoil in Europe is creating all kinds of stress in the currency markets. Many USD-based currency crosses have, or are on the verge of, breaching recent highs.

Click here to go to the live chart.
For the chart we picked out just a few of the crosses that came to our attention (there are several others in the same boat) and note that three of them belong to large BRIC economies. Yesterday we talked about the recent drop in crude oil prices but with the behavior exhibited in the above chart, that drop is being offset with weakening currencies creating very little net benefit.

Thursday, May 24, 2012

Today's Major Market Move: WTI Crude Declines 17% Since End of February

Black gold, Texas tea, Saudi Succotash - whatever you want to call it, oil lubricates the global economy. Gasoline, diesel, fertilizer, plastics, paint: all use petroleum. Nail polish, surf boards, crayons, artificial turf: yeah, it's in those too. To varying extents, the prices on all of these items should be coming down in the near future as crude oil has dropped 17% in the past three months.

Click here to go to the live chart.
Gasoline prices at the pump have reacted favorably, most notably in Norway where prices have dropped close to 10% after being over $10 per gallon. Here's our recently updated chart of global retail gasoline prices:

Click here to go to the live chart.
The group of people breathing the deepest sigh of relief would not be the workers who have to drive over one hour each way to and from wory or surfers with a chronic case of gear-acquisition-syndrome. No, the group of people who are most overjoyed at the recent price action in oil is a tiny and select few, central bankers. They have now been given the breathing room they need to open the sluices of liquidity yet again. QE3 and whatever new acronym-labeled program the ECB comes up with are now a foregone conclusion.

Wednesday, May 23, 2012

Today's Major Market Move: Nigerian Stock Market Down 6.2% in Wednesday's Session

The Nigerian benchmark equity index, the Nigerian Stock Exchange All Share, was sent tumbling in today's session to the tune of -6.2%. This made it the top loser out of all global benchmark equity indexes, barely edging out Hungary.

Click here to go to the live table.

On the whole Africa's equity markets have not suffered as much during the past few years as its European neighbors. Stock markets in South Africa, Tanzania and even Tunisia, which not so long ago experienced political upheaval, have shown a marked sense of resilience while economic crises rage to the north. Could today's movement in Nigeria indicate a spreading contagion? With Nigeria's dependence on oil and the recent drop in Brent and WTI prices, we would be careful in applying a larger scope to this event. This following chart shows there is somewhat of a correlation between oil and Nigerian stocks:

Click here to go to the live chart.

Update 4/24/2012: If you're looking for volatility, head no further than Nigeria. The Nigerian Stock Exchange All Share index rebounded in Thursday's session and nearly recovered the entire 6.2% loss.

Click here to go to the live chart.


Tuesday, May 22, 2012

Today's Major Market Move: Chesapeake Energy (ticker:CHK) Drops 26% in May

Yesterday we talked about the recent bounce in natural gas prices  so it only seemed fitting that today we discuss companies that are involved in natural gas extraction. One of the better well known names, Chesapeake  Energy Corporation (ticker: CHK), managed to find a way to come up with enough of its own bad news to completely negate the effect of the boost in natgas prices. First, let's take a look at comparison of front month natural gas contracts vs CHK's stock price since April 19th:

Click here to go to the live chart.
Over the past 30+ days, natgas has rebounded 40% while CHK moved in the opposite direction, dropping 17% (and down 26% since May 1st). The primary cause for the recent sell-off was media reports that CHK's CEO Aubrey McClendon was involved in personal financial dealings that appeared to conflict with the interests of the company he was running. Other issues that have surfaced as of late are related to director pay and excessive leverage.

If we look at the chart of actual and estimated quarterly eps for CHK, we see that earnings are not expected to rise appreciably until the end of 2013. Of course were natural gas to continue to move higher in any kind of prolonged fashion, those estimates will prove to be on the low side.
Click her to go to the live chart.

Monday, May 21, 2012

Today's Major Market Move: Natural Gas Futures Up Over 14% Month to Date

After spending a few days below the $2 level at the end of April, Natural Gas front month futures have seen a little bit of a relief rally in May. They're up 14.7% month to date making them the best performing commodity (of the ones we track). Here's the top 10 gainers in the commodities space since May 1st:

Click here to go to the live table.
The gains are even more noteworthy when considering that many commodities and stock markets have sold off hard recently due to a resurgence of the European economic crisis. Higher than expected temperatures also helped to bolster prices. However this article from Reuters notes that with inventory levels remaining at all time highs and near capacity, many traders are skeptical that gains will hold.
The surplus to last year has dropped 13 percent from late March highs, but traders noted stocks are still at record highs for this time. There are still concerns that the storage glut will drive prices lower this spring as weather demand fades and pressure prices again this summer as storage caverns fill up.
One event that could help sustain the natgas rally is if central banks decide to take aggressive action in dealing with the latest round of problems in Europe. With Brent and WTI having given up some ground lately, we believe that the likelihood of additional liquidity injection is high (particularly from the ECB).

Friday, May 18, 2012

Today's Major Market Move: Polish Zloty Weakens 8% Against US Dollar in May

The same pattern that we've seen previously continues to hold true; when the European crisis-o-meter starts flashing red, the fringe European currencies plummet in value. By 'fringe' we mean the currencies of those countries that sit just outside the edge of the Eurozone, such as Turkey, the Czech Republic, Iceland, Hungary and the topic for today's post, Poland. Since the problems in Greece have returned with a vengeance earlier this month, the Polish Zloty has tumbled 8% against the US Dollar, making it the third worst performing currency over that time frame.

Click here to go to the live table.
The Zloty is getting very close to it's last major pain point which occurred back at the beginning of the year. The USDPLN briefly breached the 3.50 mark before being reigned back in as progress was made on securing the most recent Greek bailout (here is one of our posts during that time frame).

Click here to go to the live chart.
Update: The discussions over the weekend are strongly suggesting that we haven't seen the last of Greek bailouts. Here's some details from the Star:
US President Barack Obama noted [the summit] leaders' agreement that growth and jobs must take precedence over austerity.
As all of the leaders here today agree, growth and jobs must be our top priority, Obama said at the conclusion of the meeting.
The direction the debate has taken recently should give us confidence that Europe is taking significant steps to manage the crisis, he said.
Ahead of the meeting, Obama jettisoned his neutrality, backing French and Italian efforts to rebalance German-led austerity-first policies.
Critics say two years of single-minded focus on debt reduction has fueled rampant unemployment, brought Greece to the verge of bankruptcy and deepened crises in Italy and Spain.
Expect there to be massive pressure to be placed on the ECB over the coming weeks and months to fire up the printing presses. Also expect that the country applying the greatest amount of force to be the U.S. There is an election to be won after all.


Thursday, May 17, 2012

Today's Major Market Move: Russian RTS Index Drops 5% in Thursday's Session

The Russian RTS equity index completed its 7th negative daily trading session with a 5% drop. From the beginning of that streak on May 10th up to and including today, the Russian RTS index is down an astounding 13%.

Click here to go to the live chart.
Briefly glimpsing over the composition of the RTS Index, one notices that the index is heavily skewed towards energy and commodities. Although several energy related commodity futures were down noticeably during that same period, the declines were only a fraction of the drop in the RTS index. Here's a look a top declining front month commodity futures from May 10th to May 17th:

Click here to go to the live table.
Since the action in commodities alone doesn't explain the magnitude of the drop in the index, it would make sense to also place blame on the resurgence of the European debt crisis.

Friday, May 11, 2012

Today's Major Market Move: Russian 5 Year CDS Up 15% Month To Date

Many of the 5 year sovereign credit default swaps that we track saw significant declines at the beginning of the year, however now those same CDS have started to make moves higher over the past two months. One of the more pronounced moves has been seen in the Russian 5 year which is up 15% so far in May. Here's the top 10 gainers in sovereign credit default swaps in May:

Click here to go to the live table.
Even with this recent move most 5 year sovereign CDS are still well below their 2012 highs and this includes the Russian swap. The Spanish 5 Year is one of the few which has managed to eclipse its previous 2012 high. In the following line chart we show both the Spanish and Russian 5 year swaps going back to October of 2011.

Click here to go to the live chart.
According to this article from Buisnessweek, Russian bonds have weakened recently as a result of declining oil prices. If we compare the Russian 5 year CDS against front month Brent futures, we see a fairly tight inverse relationship.

Click here to go to the live chart.


Thursday, May 10, 2012

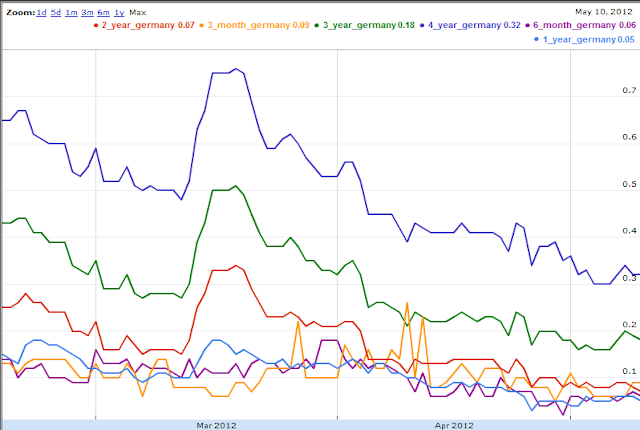
Today's Major Market Move: German 2 Year Bond Drops 27 Bps in Past 2 Months

The German 2 year had established a floor recently at a yield of .08 that was able to hold for the past couple of weeks. However today's action proved to be too much as yields broke to a new low and the flight to safety in Europe continues.

Click here to go to the live chart.
We noticed a pretty tight correlation between the 2 year over the last 60 days and the DAX in terms of % change (we're working on adding the ability to compare a data set in absolute terms and a data set in % terms in the same chart).

Click here to go to the live chart.
The German yield curve looks very interesting with almost all the directions trending downwards from already historically low levels. There's a traffic jam with the short duration bonds as they converge towards near-zero.

Click here to go to the live chart.
Here's a blow up of all the bonds with duration shorter than 5 years:

Click here to go to the live chart.


Wednesday, May 9, 2012

Today's Major Market Move: Cotton Futures Down 11% Month to Date

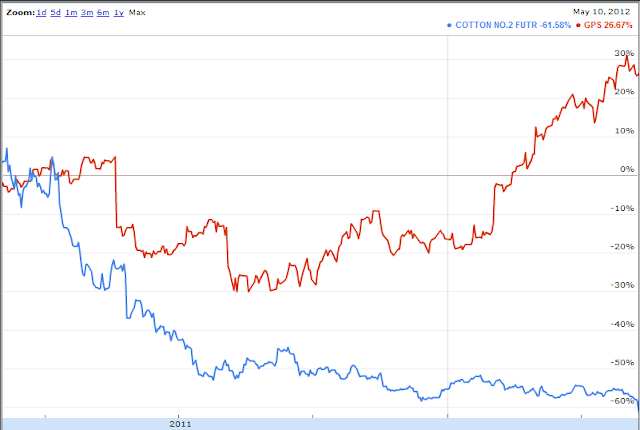
Cotton futures have dropped another 11% this month and we say 'another' because if you go back to March of last year, cotton has dropped an astounding 60%. Here's the line chart in terms of % change going back to the beginning of 2011:

Click here to go to the live chart.

Most commodities are down for the month of May (19 out of 29 that we track) with one notable exception being natural gas. Natural gas was so beaten down, having dropped below $2 mmBtu, that it was due for a relief rally.  Here are the top 12 decliners in the commodities space for the month of May:

Click here to go to the live table.
It is worth point out that both brent and wti have dropped over 5% in the past week and half with WTI having a decent sized cushion below the $100/barrel level. It will be interesting to see how quickly this spills over to retail gas prices which provides us with the perfect opportunity to plug our Global Gasoline Price chart (just updated yesterday).

Going back to cotton, when we talk about cotton futures occasionally we like to take a peek at one of the largest consumers of the raw material, The Gap (ticker: GPS). Here's our comparison chart of cotton prices along side the GPS stock price.

Click here to go to the live chart.


Tuesday, May 8, 2012

Today's Major Market Move: Myanmarese Kyat is Devalued by Over 13000%

No the zero key on this computer did not get stuck in the down position. Myanmar officials decided a little over a week ago to bring the official exchange rate in line with the unofficial rate. This meant that the USDMMK cross went from 6.45 to 822 overnight, an increase of over 13000%.

Click here to go to the live chart.

Although the chart makes this move appear sudden, the unofficial rate had been hovering close to 1000 Kyat per US Dollar for several years now, so it's doubtful any Myanmarese were taken by surprise. Even with this change, the Kyat is not being left to the whims of the free market. The currency will only be allowed to float within a prescribed window, in a manner similar to how the Chinese Yuan is currently managed.

Monday, May 7, 2012

Today's Major Market Move: Cypriot Equity Market Tanks 12% in Monday's Session

It's not that often that you see a stock market move 12% in a single day, but as Cypriot equities showed us today, it can and does happen. In the aftermath of what was essentially a no-confidence vote in austerity measures and the current plan for the Greek economy, Greek and Cypriot stocks, moving in tandem as usual, took a bath. The FTSE/ASE 20, the Greek benchmark equity index, dropped 8% to go along with the 12% drop in the Cypriot benchmark equity index, the General Market CSE. Here's the top 10 equity index decliners in today's session:

Click here to go to the live table.
Cypriot equities had already broken through the lows of 2011/2012 a couple of days ago and today's move has put Greek equities on the brink of doing so.

Click here to go to the live chart.
If we expand our time window back to the beginning of 2008, we see astounding declines of over 95% for Cypriot stocks and over 90% for Greek stocks.

Click here to go to the live chart.